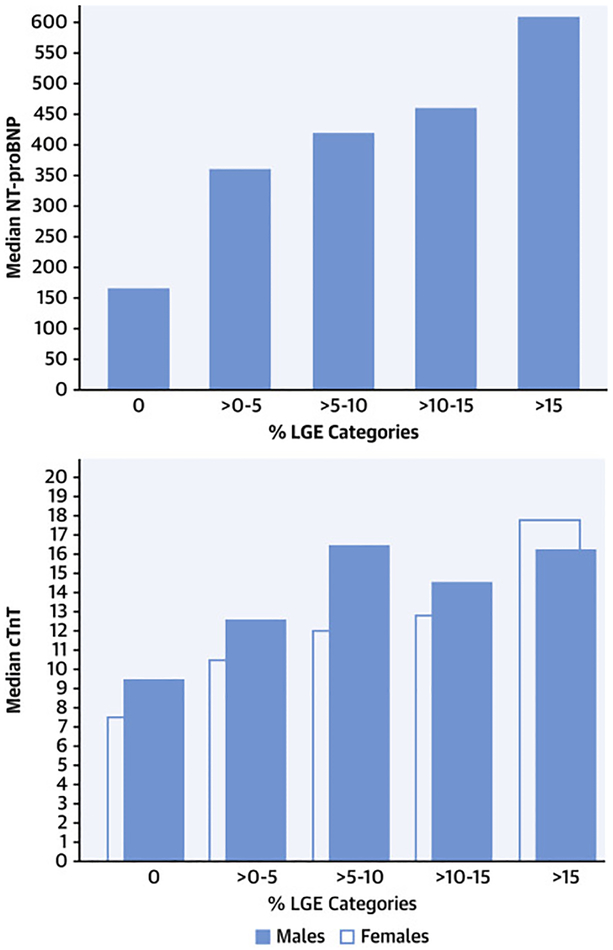
Figure 2. Relationship of biomarkers to increasing amounts of late gadolinium enhancement (LGE).
N-terminal pro-brain natriuretic peptide (NTproBNP) and high sensitivity troponin T (cTnT) were measured in each patient as was the extent of LGE as a % of left ventricular mass on cardiac magnetic resonance imaging. Left – Median NTproBNP showing increasing levels relative to patients with increasing amounts of LGE (P<0.001 for trend). Right – similar trend shown for cTnT (separated by gender due to different normal values) with p<0.001 for trend for both.

