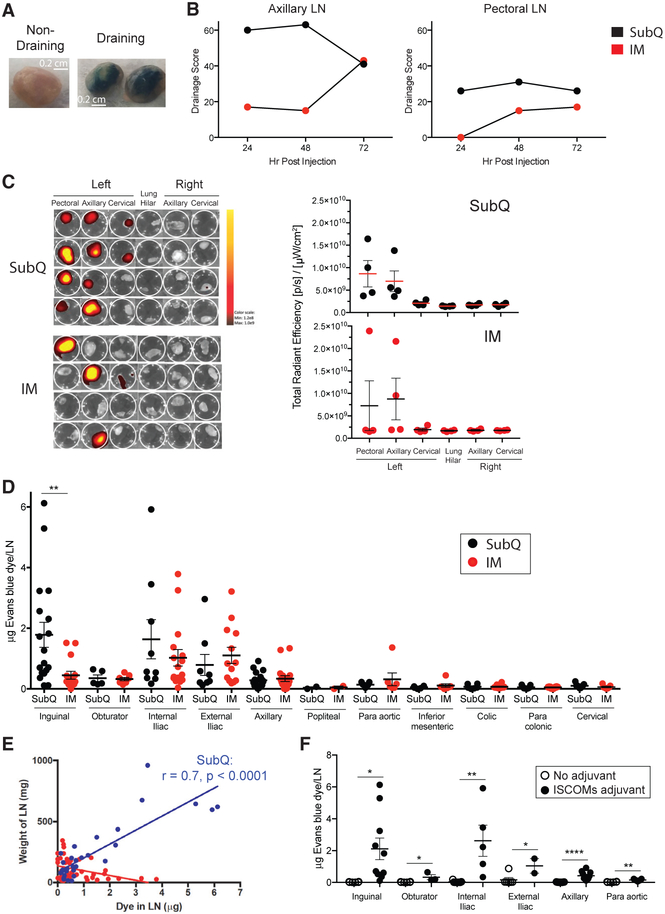
Figure 1. LN Drainage after Injection at the Deltoid or Quadricep.
(A) EB in draining and non-draining LNs.
(B) EB drainage score over time after bilateral s.c. or IM injection at the deltoid. Drainage to other LNs was not observed (listed in STAR Methods). n = 6, one per immunization condition per time point.
(C) IVIS fluorescent quantification of A647 labeled eOD-GT8 60-mer in LNs 48 h after injection at the left deltoid. Left, each row represents an individual animal. Right, each point represents an individual LN cluster from an individual animal shown at the left. n = 8, four per immunization condition. Mean and SEM shown.
(D) EB quantification of drainage after bilateral s.c. or IM injection at the quadricep in the presence of a soluble saponin-based ISCOMs-class adjuvant at 48 h. **p < 0.01 (unpaired t test, two tailed). n = 4 animals, two per immunization condition. Each point represents an individual LN. Mean and SEM shown.
(E) Correlation between the amount of EB dye (μg) and LN weight (mg). Subcutaneous injection (blue) and intramuscular infection (red) (unpaired t test, two tailed). Each point represents an individual LN.
(F) EB quantification of drainage after bilateral s.c. injection at the quadricep with or without a soluble saponin-based ISCOMs-class adjuvant at 48 h. *p < 0.05, **p < 0.01, ****p < 0.0001 (unpaired t test, one tailed). n = 4 animals, two per condition. Each point represents an individual LN. Mean and SEM shown
See also Figure S1.

