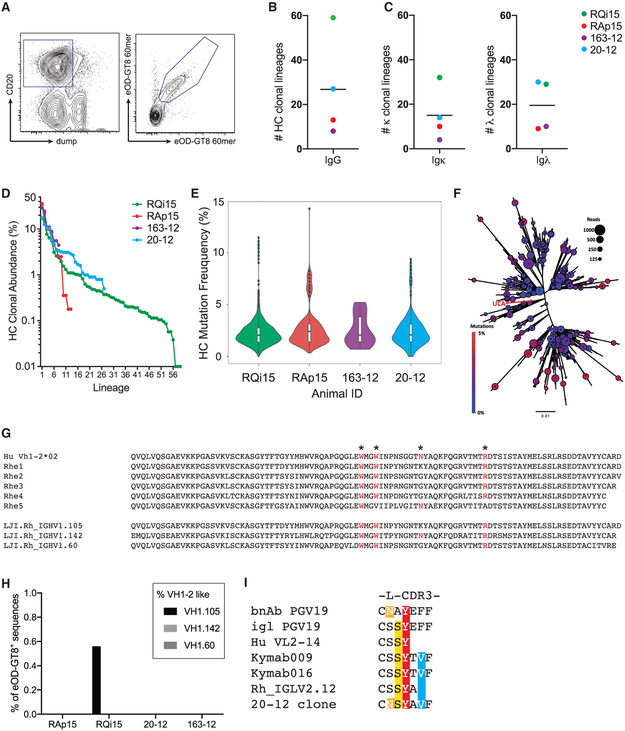
Figure 4. eOD-GT8 60-mer-Specific BGC Cell Lineages after s.c. Immunization.
(A) Representative sorting gate for eOD-GT8 60-mer-specific B cells at day 26 post-immunization.
(B) Number of heavy chain (HC) lineages present among eOD-GT8 60-mer specific B cells. Each point represents an individual RM. n = 4.
(C) Number of light chain kappa (κ) or lambda (λ) lineages present among eOD-GT8 60-mer specific B cells. Each point represents an individual RM. n = 4.
(D) Clonal abundance of individual lineages by HC from s.c. immunized RMs. Each point represents an individual B cell lineage.
(E) Nucleotide HC SHM frequency of eOD-GT8 specific B cells after one immunization for each immunized animals. Violin plot, individual points represent B cell lineages, white bars represent quartiles. n = 4.
(F) Example of the diversity found within a single eOD-GT8 60-mer-specific B cell lineage. The unmutated common ancestor (UCA) of the lineage is at the center of the plot indicated by the red arrow. Circle size indicates the number of reads for each variant, and circle color indicates the mutation count. Additional example lineages are shown in Figure S3.
(G) RM HC V gene with similarity to human VH1-2 identified in the LJI RM Ig annotation. Critical amino acids for eOD-GT8 binding are noted (*).
(H) Frequency of eOD-GT8 60-mer-specific B cell using huVH1-2 like V genes.
(I) A λ RM light chain sequence with a 5aa L-CDR3 similar to the VRC01-class bnAb PGV19 and Abs induced in human Ig loci transgenic mice immunized with eOD-GT8.
Each point represents an individual animal. n = 8, four LN FNAs per immunization condition at each time point.
See also Figures S4 and S5.

