
Fig. 2.
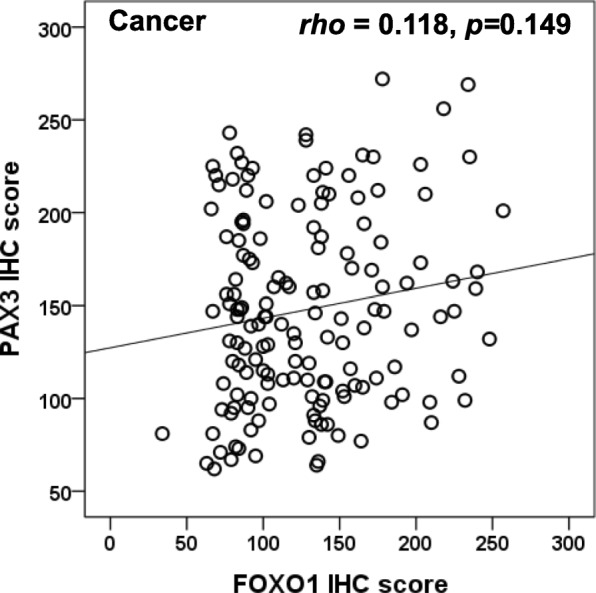
Correlation between the expression levels of FOXO1 and PAX3. FOXO1 expression showed a tendency to be positively correlated with PAX3 expression in EOC. (Spearman’s rho = 0.118, p = 0.149)
Official websites use .gov
A
.gov website belongs to an official
government organization in the United States.
Secure .gov websites use HTTPS
A lock (
) or https:// means you've safely
connected to the .gov website. Share sensitive
information only on official, secure websites.
Correlation between the expression levels of FOXO1 and PAX3. FOXO1 expression showed a tendency to be positively correlated with PAX3 expression in EOC. (Spearman’s rho = 0.118, p = 0.149)