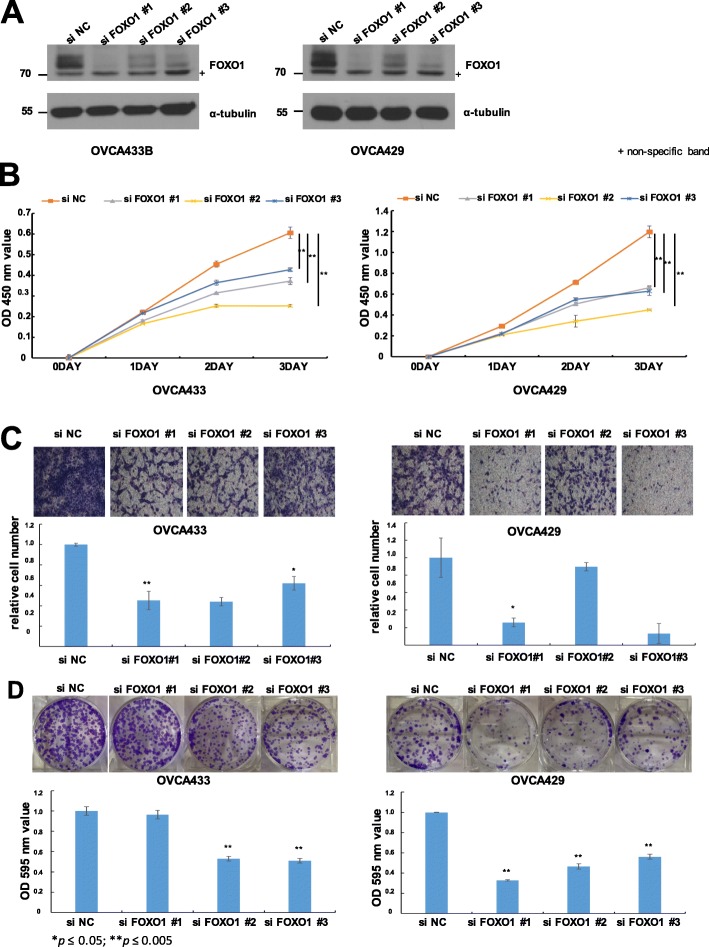
Fig. 4.
Effect of FOXO1 on the proliferation and migration of OVCA433 and OVCA429 cells. a Western blot analysis of FOXO1 expression following siRNA (siFOXO1)-transfection induced knockdown in OVCA433 and OVCA429 cells. FOXO1 protein expression was decreased compared to the levels of negative control (siNC) cells. b Curves of the viability of siNC- and siFOXO1-transfected OVCA433 and OVCA429 cells collected at different time points. The viability of FOXO1 knockdown cells decreased. c Cell migration assay of siNC- and siFOXO1-transfected OVCA433 and OVCA429 cells. Upper panel: representative images of migrated cells. Lower panel: quantitative results of cell migration experiments. The assay showed that FOXO1 knockdown (siFOXO1-transfected cells) resulted in decreased migration and invasion compared to negative control (siNC) cells. d Colonogenic assay performed on OVCA433 and OVCA429 cells. Upper panel: representative figures of colonogenic assay. Lower panel: quantitative results of colonogenic assay. Colony formation decreased in FOXO1 knockdown (siFOXO) compared to negative control (siNC). The number of asterisks (*) indicates the level of significance: *p ≤ 0.05, **p ≤ 0.005. Data and error bars represent the mean ± SD of triplicate experiments.

