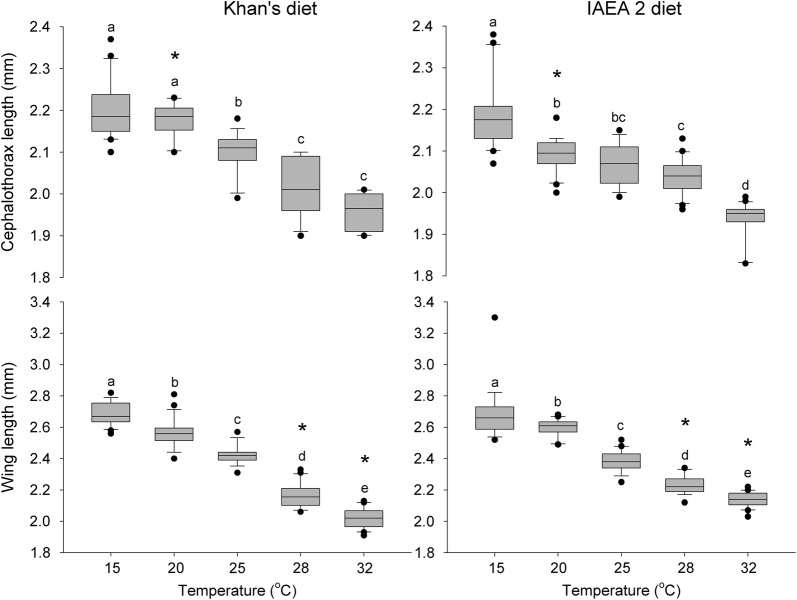
Fig. 3.
Box plots of cephalothorax and wing lengths for Ae. aegypti males reared using various combinations of larval diets and temperature regimes. Box plots with the same letter exhibit no significant differences among test temperatures, Tukey’s HSD test, P ≥ 0.05. Horizontal bars indicate median values, boxes show the lower and upper quartiles of the datasets, and outliers are represented by solid circles. (*) indicates that the means for the diets are significantly different, Studentʼs t-test for independent samples, P < 0.05. Error bar represent the standard error

