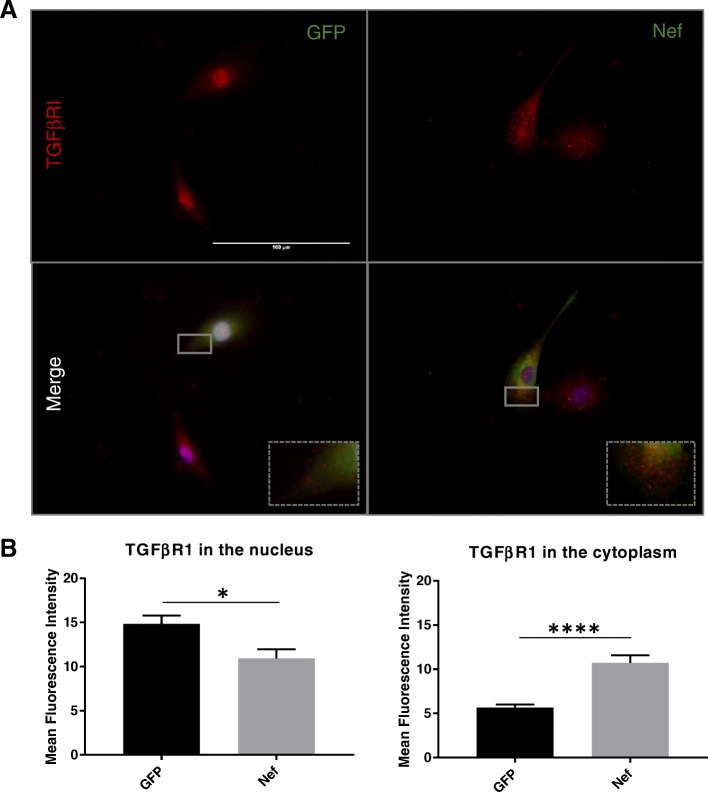
Fig. 2.
Nef increases TGFβR1 expression in astrocytes. a Representative images of TGFβR1 expression in astrocytes transfected with GFP or Nef (TGFβRI in red, GFP or Nef in green, DAPI in blue). Additional groups of the transfected cells were treated with SD208. Ten images per treatment from three individual experiments were obtained. b Quantification of mean fluorescent intensity in the nucleus (p = 0.02) and cytoplasm (p < 0.0001) of the cells. Images were analyzed with ImageJ. Scale bar is 100 μm

