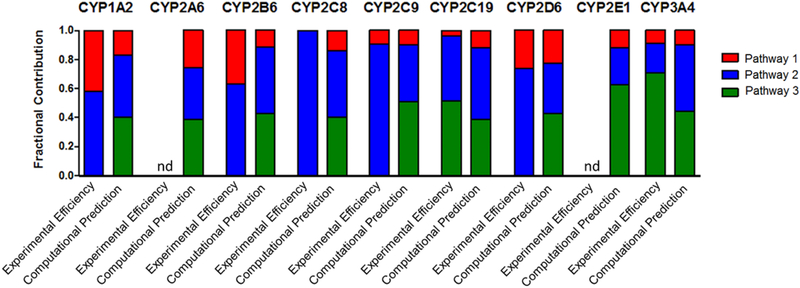
Fig. 5. Comparison of experimental kinetics and modeling predictions for P450 catalyzed terbinafine N-dealkylations.
Modeling predictions compared to experimental kinetic parameters based on prediction scores (0–1.0) and kinetic efficiencies (Vmax/Km) scaled to fractional values. Fractional values were calculated based on predictions and efficiencies for metabolic split ratios of pathways within each individual P450. N-methyl-1-naphthyl methylamine, N-desmethyl-terbinafine, and 1-napthaldehyde were markers for the initial reactions of Pathways 1, 2, and 3, respectively. The graphs illustrate the calculated fractional values listed in Table 4. nd = no metabolite detected

