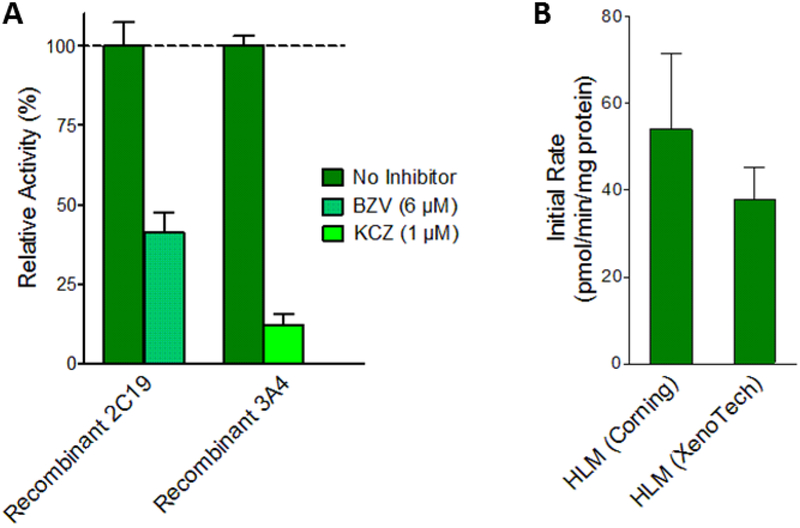
Fig. 6. Comparison of terbinafine metabolism in HLM and recombinant P450s.
Control experiments were carried out to confirm source and reliability of 1-naphthaldehyde formation rates measured in previous experiments. (A) 1-Naphthyaldehdye yields from recombinant CYP 2C19 and 3A4 measured in the presence of selective inhibitors. CYP2C19 was incubated with 6 μM (+)-N-3-benzylnirvanol (BZV) (yellow-green) and 3A4 was incubated with 1 μM ketoconazole (KCZ) (blue-green). Metabolite levels are reported as percentages of those from reactions without inhibitors (green). (B) Total 1-naphthaldehyde (pathway 3.1) formation rates were measured from Corning HLM150 and Xenotech HLM50 pooled microsomal systems. Statistically significant differences were determined by Student’s T-test. (C) Recombinant P450 reaction efficiencies (Vmax/Km) for each pathway were scaled to microsomal efficiencies for comparison. Scaling was achieved using the average percentage concentration scaling method (Yu & Haining, 2001) based on average percentages of specific P450s reported by others (Kawakami et al., 2011). Units, Vmax: pmol/min/mg protein, Km: μM

