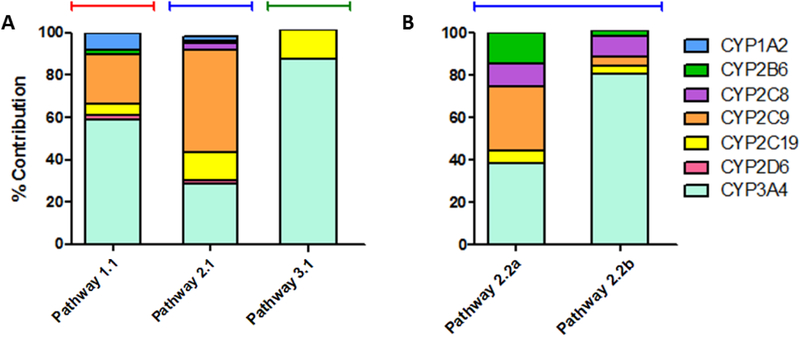
Fig. 7. In vitro to in vivo scaling of recombinant P450 kinetics to model hepatic clearance using average microsomal protein concentrations.
Efficiencies (Vmax/Km) for metabolite formation from substrate by recombinant P450s measured in this study (CYP1A2, 2B6, 2C8, 2C9, 2D6) and our previous study (CYP2C19, 3A4) (Davis et al., 2019) were scaled to model microsomal relative abundances using measured percentages of individual P450 isozymes reported by others (Kawakami et al., 2011). Calculated values for percent contributions for each P450 are listed in Table 5. (A) Percent contributions to primary reactions from terbinafine were calculated based on efficiency of N-methyl-1-naphthyl methylamine formation for Pathway 1, desmethylterbinafine formation for Pathway 2, and 1-naphthaldehyde formation for Pathway 3. (B) Percent contributions to secondary reactions from terbinafine were calculated based on efficiency of 1-naphthyl methylamine formation from desmethyl-terbinafine from Step 2.2a and 1-napthaldehyde formation from desmethyl-terbinafine for Step 2.2b.

