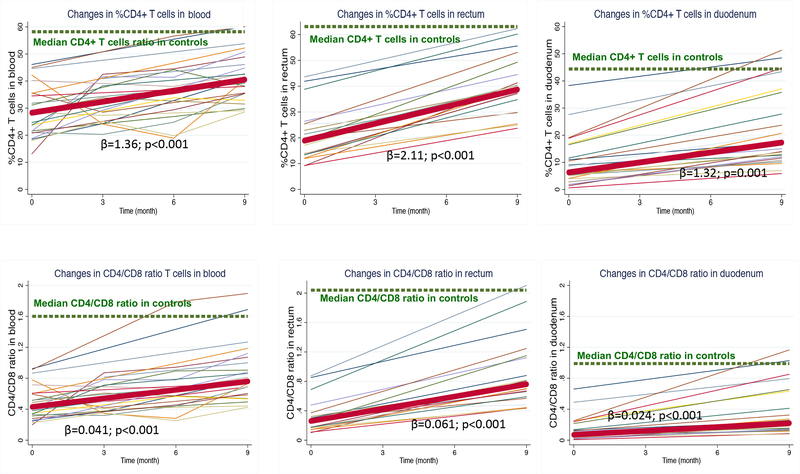
Figure 1. (A) Changes in %CD4+ T-cells. (B) Changes in CD4/CD8 ratio.
Cross-sectional values in controls are represented by a dashed green line). Individual trajectories of values derived from HIV-infected participants are represented by thin color lines, and mean values are illustrated by a thick red line. The coefficient of slope (β) ant its P value was calculated by regressing the %CD4+ T-cells over time.

