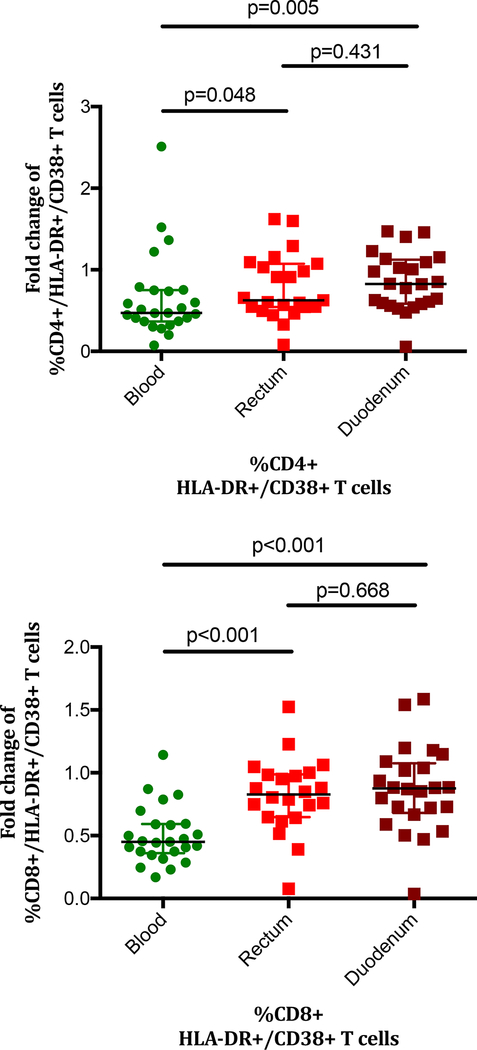
Figure 2. Changes in proportions of (A) CD4+ and (B) CD8+ T-cells with the activated phenotype compared with baseline activation levels.
No change from baseline to the 9-month measurement would result in a fold change of 1. ART had minimal impact on T-cell activation level changes in GALT P values were calculated using the Mann Whitney’s U test.

