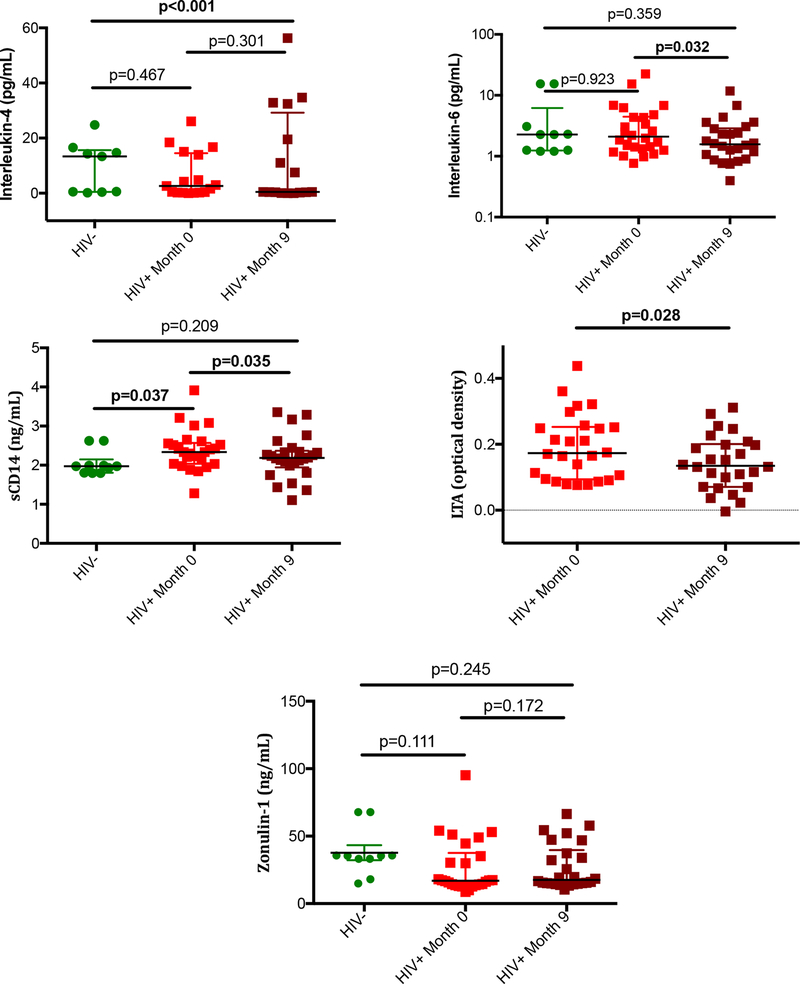
Figure 4. Soluble biomarkers of inflammation and intestinal damage.
Plasma levels of IL-4, IL-6, sCD14, LTA, and zonulin-1 are represented. P values between HIV- and HIV+ groups were calculated using the Mann Whitney’s U test. P values between month 0 and month 9 time-points in the HIV+ group were calculated using the Wilcoxon signed-rank test. LTA levels could not be measured in controls due to insufficient plasma volume.
Zonu, w0 N=26

