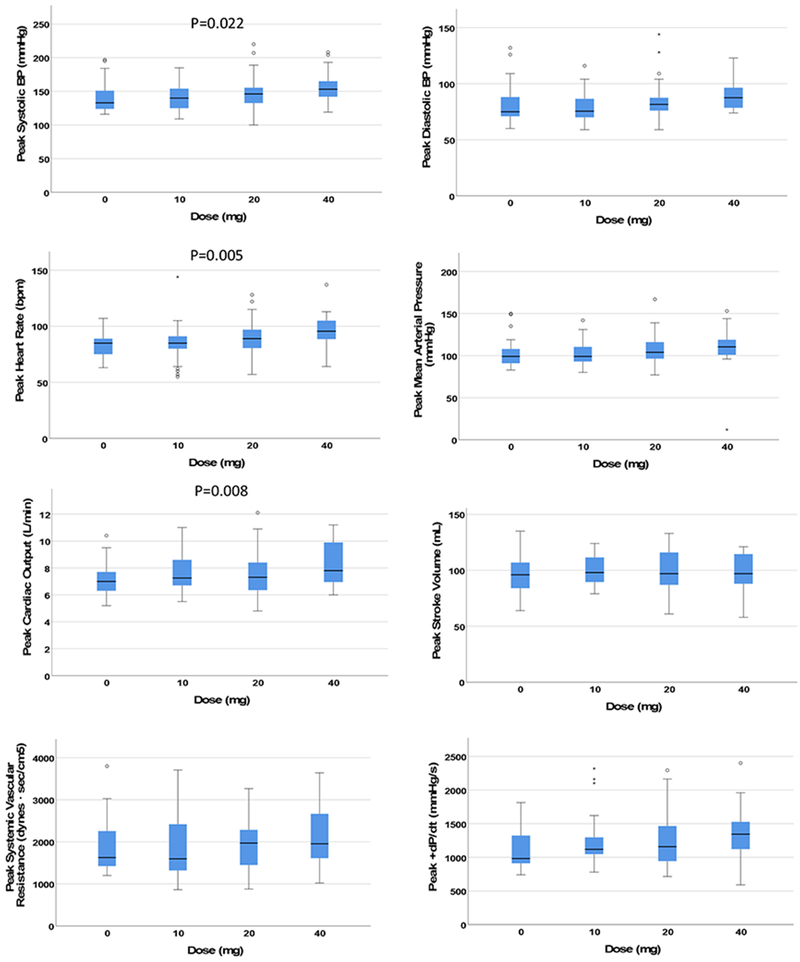
Figure 2.
The y-axis represents peak changes (sustained over a minimum of 60 seconds) in the hemodynamic parameter during the 30 minutes after cocaine infusion. Short horizontal lines identify the median, boxes identify the interquartile range (IQR), and whiskers identify an additional 1.5 times the IQR range. Asterices and circles represent outlying data points beyond 1.5 times outside the IQR. +dP/dt = first derivative of left ventricular pressure increase during systole.

