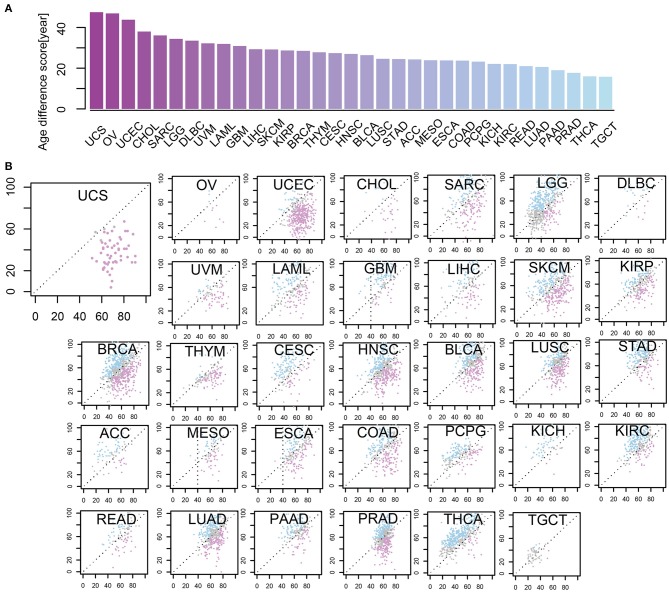
Figure 4.
The levels of some methylation sites were differential in age-related cancer samples between m-age and chronological age. (A) Age different scores between chronological age and predicted m-age among 33 cancer types. (B) The relationship between chronological age and predicted m-age for all the 33 disease types. Compared to the chronological age group, the pink color indicates that the predicted m-age group was down-regulated, the blue color indicates that the predicted m-age group was up-regulated, and the gray color indicates that the predicted m-age group remained unchanged.

