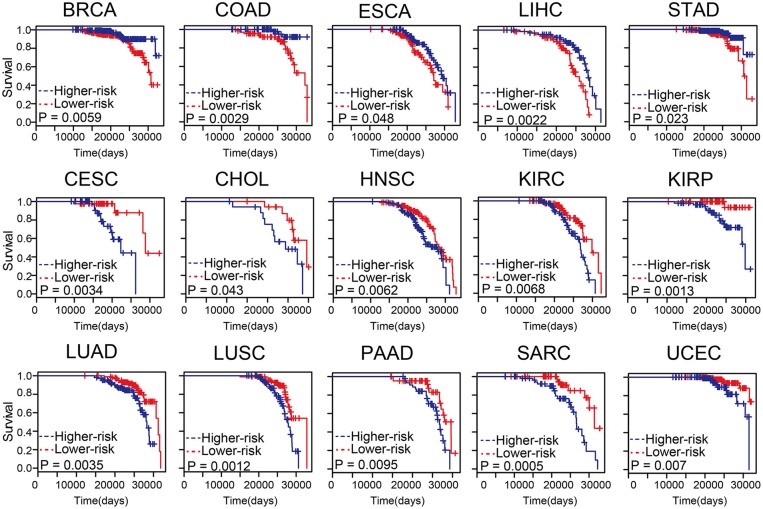
Figure 5.
The differential methylation sites in age-related samples were associated with survival. Kaplan-Meier survival analysis of two groups of patients with high- (blue line) and low- score (red line) groups. Survival days are shown along the X-axis. Overall survival rates are shown along the Y-axis.

