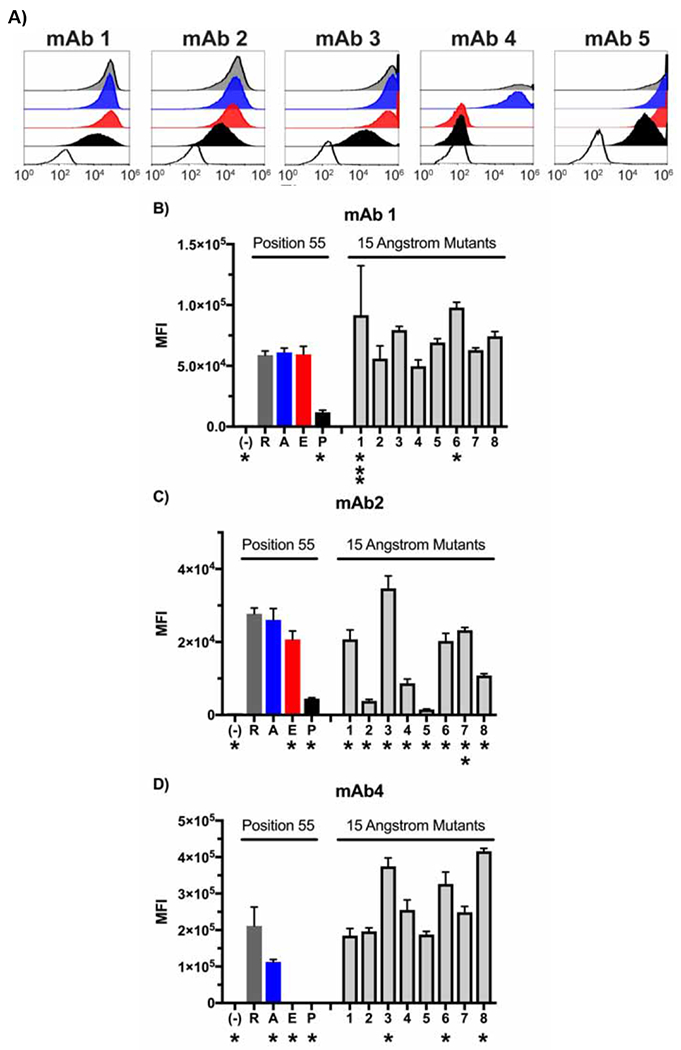
Figure 2:

Expression analyses of point-mutant variants of the SLA-DQ protein. Panel A: HEK293 cells co-expressing SLA-DQα*0101 and SLA-DQβ1*0601 (R55, gray histograms) or position 55 mutants of SLA-DQβ1*0601. Cells were stained with five different monoclonal antibodies and analyzed by flow cytometry. Mutations analyzed included alanine (55A, blue histograms), glutamate (55E, red histograms), or proline (55P, black histograms). SLA-DQ deficient but pig CD74 positive cells were also stained with the monoclonal antibodies as a negative control (white histograms). Triplicate stainings of these cells were performed with panels B, C, and D showing the mean and standard deviation for the MFI of three monoclonal antibodies (mAb1,2, and 4). SLA-DQβ1*0601 mutants in eight amino acids within a 15 Angstrom radius of amino acid 55 were also tested. In panels B and C, asterisks note mutations that show significant alteration in SLA-DQ expression when compared to the naturally occurring SLA-DQ variant with arginine at position 55 of the beta chain (R). Binding comparisons were made using one-way ANOVA with Dunnet’s correction for multiple comparisons. One asterisk marks p-values less than 0.001. Two asterisks mark p value of 0.042, and three asterisk marks a p value of 0.023. No asterisk indicates p value of comparison greater than 0.05.
