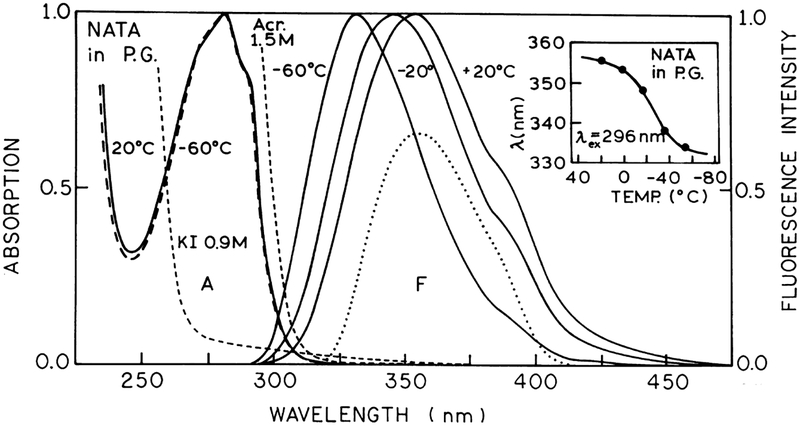
Fig. 1.
Absorption and fluorescence spectra of NATA in propylene glycol at different temperatures. The dotted line shows the emission spectrum of NATA observed through the combination of Schott WG-335 and Corning 7–51 filters used to select the emission for intensity decay measurements. Insert: Dependence of the fluorescence emission maximum of NATA in propylene glycol (●) on temperature with excitation wavelength at 296 nm.

