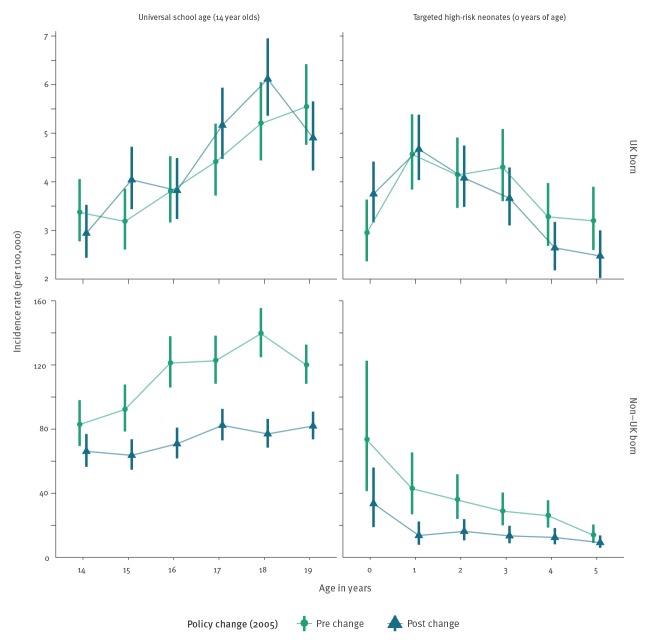
Figure.
Mean incidence rates per 100,000 population, with 95% confidence intervals for each retrospective cohorta studied to assess the effect of the 2005 change in BCG policy, stratified by the vaccination policy and UK birth status, England, 2000–2015
BCG: Bacillus Calmette–Guérin; UK: United Kingdom.
a Cohort definitions figure in Table 1.
The top and bottom panels are on different scales in order to highlight trends in incidence rates over time.

