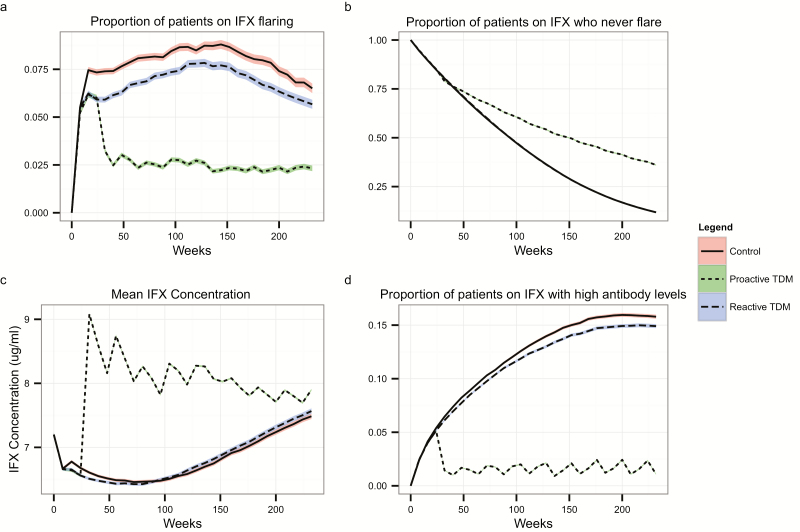
FIGURE 4.
A, Proportion of patients currently on IFX experiencing a flare at each time step; (b) proportion of patients in the cohort who never experienced a flare; (c) Mean IFX concentration at each time step; (d) Proportion of patients who develop anti-IFX antibodies over time. Bands around lines represent the standard errors of the means.

