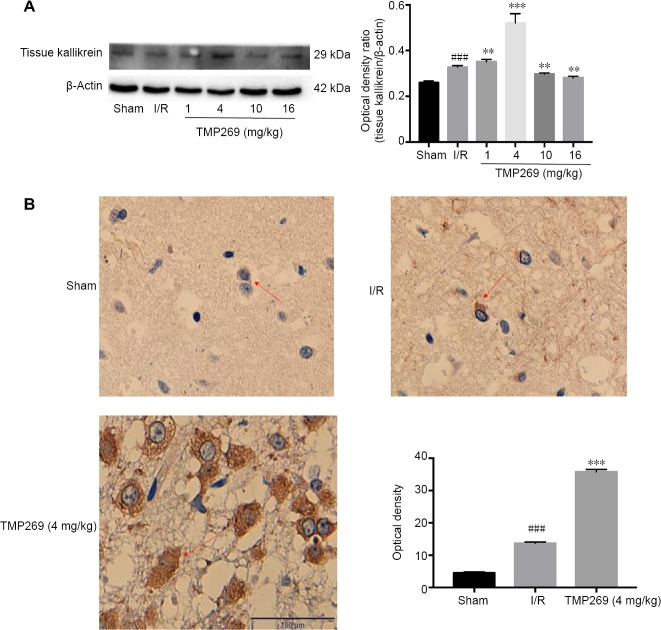
Figure 4.
TMP269 up-regulates the expression of tissue kallikrein.
(A) Western blot analysis of tissue kallikrein. (B) Immunohistochemistry images and quantitative analysis of mean optical density. The number of positive cells in the infarct area increased and the plasma was deeply stained in the TMP269 group. The red arrows indicate cytoplasm; tissue kallikrein is expressed in cytoplasm; and the darker the color, the more expression of tissue kallikrein. Scale bar: 100 μm. Data are expressed as the mean ± SD. **P < 0.01, ***P < 0.001, vs. ischemia/reperfusion (I/R) group; ###P < 0.001, vs. sham group.

