Figure 1.

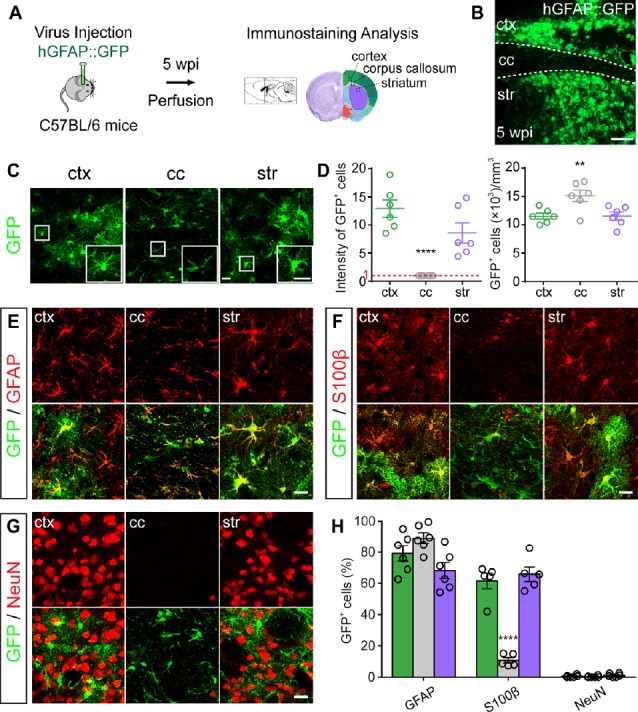
AAV hGFAP::GFP specifically infects astrocytes in the grey matter and white matter of mice.
(A) Schematic diagram showing the experimental design. Area in green indicates cortex; area in grey indicates corpus callosum; and area in purple indicates striatum. (B) AAV GFAP::GFP infects wide areas in the adult mouse forebrain across the cortex (ctx), corpus callosum (cc), and striatum (str) at 5 weeks post viral injection (wpi). Scale bar: 200 μm. (C) Enlarged view of the AAV GFAP::GFP infected astrocytes in the cortex, corpus callosum, and striatum at 5 wpi. Note that the fibrotic astrocytes in the corpus callosum are different in morphology from the protoplasmic astrocytes in the cortex and striatum. Scale bars: 20 μm. (D) Quantified data showing comparison of the GFP intensity (left panel) and the number of GFP+ cells (right panel) in grey matter versus white matter (**P < 0.01, ****P < 0.0001, one-way analysis of variance, n = 6 animals). Green circles represent cortex, grey circles represent corpus callosum, and purple circles represent striatum. (E and F) Representative images showing the co-labeling of GFP+ cells (green) with the astrocytic markers GFAP (E, red, 5 wpi) and S100β (F, red, 5 wpi). Scale bars: 20 μm. (G) Representative images showing that GFP+ cells (green) did not colocalize with neuronal marker NeuN (red) at 5 wpi. Scale bar: 20 μm. (H) Quantification showing the percentage of GFP+ cells co-labeled with different markers (GFAP, S100β and NeuN) in the cortex, corpus callosum and striatum at 5 wpi. GFAP and NeuN, n = 6 animals, 118–239 cells/animal; S100β, n = 5 animals, 153–360 cells/animal, ****P < 0.0001 (one-way analysis of variance). Green columns represent cortex, grey columns represent corpus callosum, and purple columns represent striatum. Data are shown as mean ± SEM. Dashed lines indicate the outline of the corpus callosum. GFAP: Glial fibrillary acidic protein; GFP: green fluorescent protein; NeuN: neuronal nuclei; S100β: S100 calcium binding protein beta.
