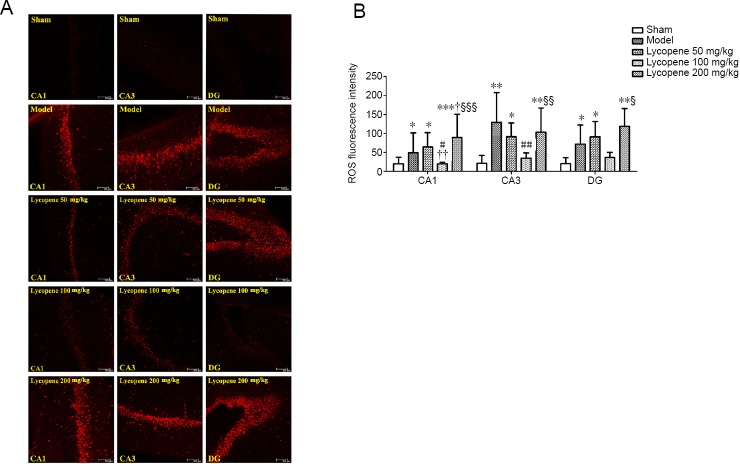
Figure 6.
Effect of lycopene on the level of ROS in the hippocampus of rats from each group.
(A) ROS fluorescence in the hippocampus of rats in different groups determined by dihydroethidium staining (Red: ROS; Scale bars: 100 µm). (B) Mean values of ROS fluorescence intensity in the hippocampus (mean ± SEM, n = 3; one-way analysis of variance followed by Dunnett’s post hoc test). *P < 0.05, **P < 0.01, ***P ≤ 0.001, vs. sham group; #P < 0.05, ##P < 0.01, vs. model group; †P < 0.05, ††P < 0.01, vs. lycopene 50 mg/kg group; §P≤ 0.05, §§P ≤ 0.01, §§§P ≤ 0.001, vs. lycopene 100 mg/kg group. CA1: Cornu ammonis region 1; CA3: cornu ammonis region 3; DG: dentate gyrus; ROS: reactive oxygen species.

