
Figure 3.
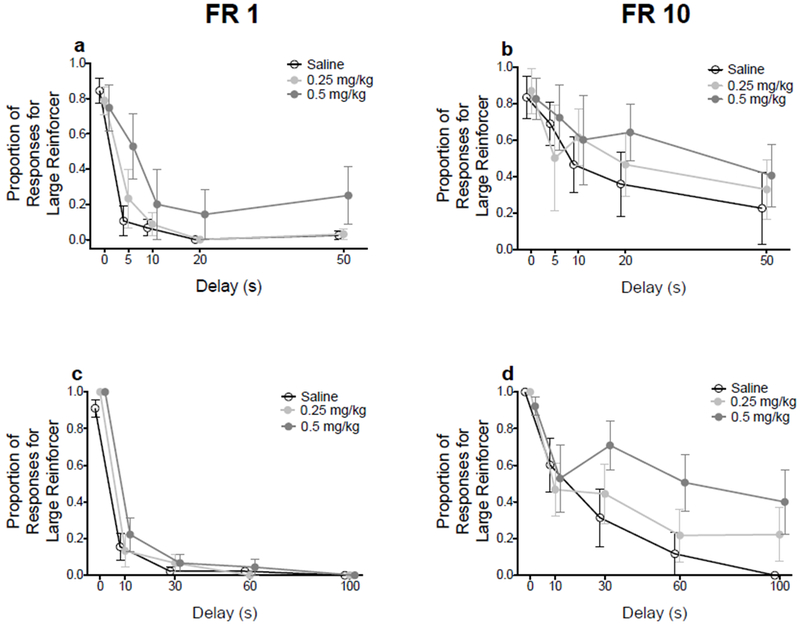
Mean (±SEM) proportion of responses for the large magnitude reinforcer following amphetamine administration. Graphs in the left column represent rats trained on the FR 1 schedule of reinforcement. Graphs in the right column represent rats trained on the FR 10 schedule of reinforcement. Graphs in the top row represent rats trained on the short delay sequence. Graphs in the bottom row represent rats trained on the long delay sequence.