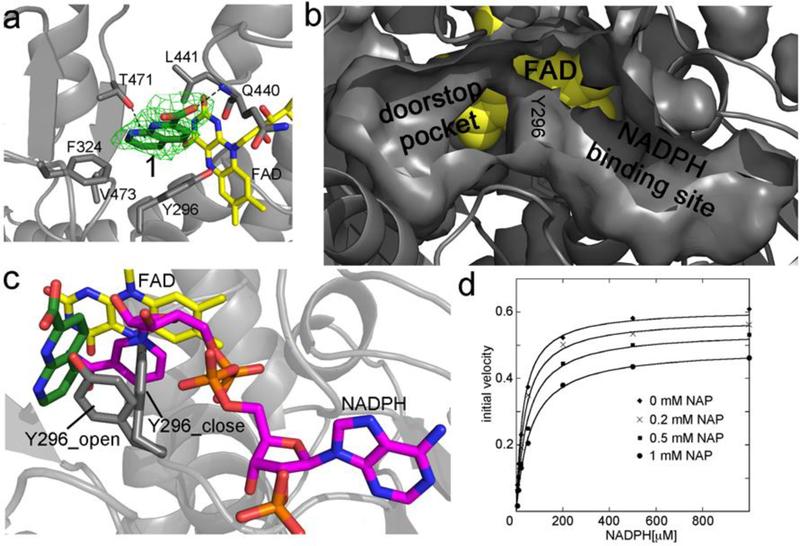
Figure 1.
a) Crystal structure of the 1,8-naphthyridine-2-carboxylate (in green sticks, compound 1 in Table 1) in complex with SmTGR and bound in the doorstop pocket. The green electron density map represents the Fo – Fc omit map contoured at 3σ. FAD is in yellow sticks and the SmTGR subunit is in grey cartoon. The hydrophobic amino acid residues within 5 Å contacting 1 are displayed as grey sticks. The H-bond with the main chain of Q440 and the face-on H-bond with T471 are shown as dotted lines. b) The solvent exposed surfaces of the doorstop and NADPH pockets are displayed together with the surface of Y296 in the closed conformation at their boundary. FAD is shown in yellow spheres. b) Superposition between the complexes of the SmTGR-1 and SmTGR-NADPH (PDB ID: 2X99). There is not direct overlap between NADPH (in magenta sticks) and 1. By contrast, overlaps are present between NADPH and Y296 (in gray sticks) in the closed conformation and between 1 and Y296 in the open conformation. d) Mixed inhibition of SmTGR by 1. Curves are steady state experiments where SmTGR is in presence of different concentrations of 1 and its activity is tested varying NADPH, ranging from 0.01 to 1 mM, at saturating DTNB concentration (3 mM). There is an apparent lowering of both KM and kcat consistent with a mixed inhibition mechanism. Data represent averages of three experiments.

