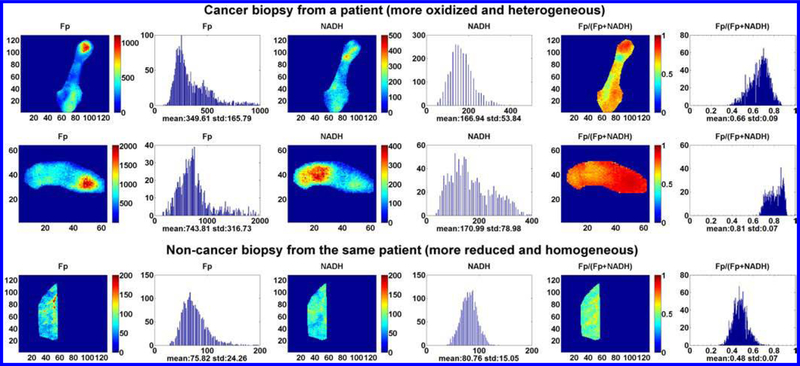
Fig. 1.
The typical redox images of the cancerous and non-cancerours breast tissue biopsies from a patient. From left to right: Fp, NADH, and the Fp redox ratios images and the corresponding histograms. The figure is reproduced with permission from Ref. 57.

