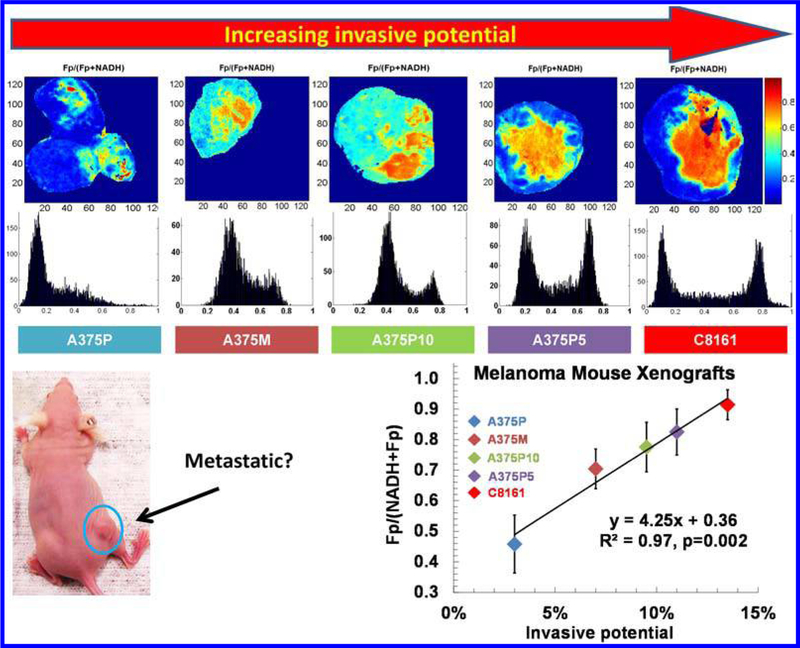
Fig. 2.
The typical Fp redox ratio images and their corresponding histograms of the five melanoma lines (A375P, A375M, A375P10, A375P5, and C8161) and the positive linear correlation between the Fp redox ratio and tumor invasive potential. The Fp redox ratios in the redox core (the right peaks in the histograms) were plotted against the invasive potentials of the five cell lines measured by the Boyden chamber method. The figure is reproduced with permission from Ref. 44.

