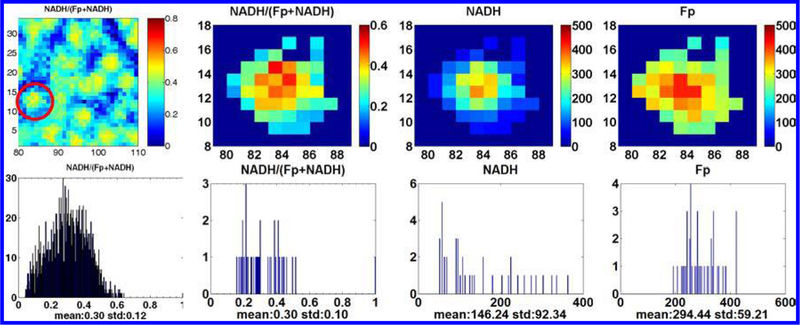
Fig. 9.
The typical images of mouse embryonic stem cell colonies and their corresponding histograms. The images show that the undifferentiated cells (in the central region) are more reduced. The right three images and the corresponding histograms correspond to the individual ESC colony in the red circle of the first redox image.

