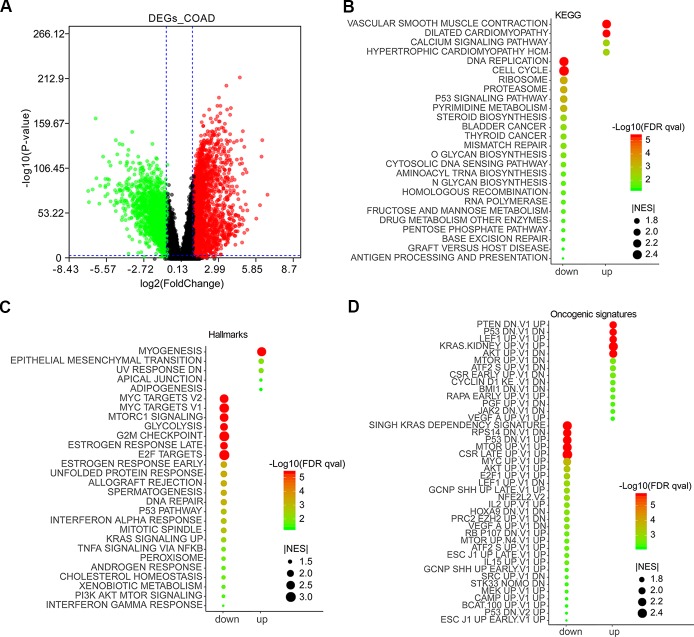
Figure 1.
Differentially expressed genes (DEGs) in colon adenocarcinoma (COAD) and functional enrichment analysis by gene set enrichment analysis (GSEA). DEGs in COAD patients were mined by GEPIA 2 (http://gepia2.cancer-pku.cn/#analysis). Red and green scatter represented upregulated and downregulated genes, respectively (A). Enrichment analyses of KEGG (B), Hallmarks (C), and oncogenic signatures (D) were conducted by GSEA and visualized by ImageGP (http://www.ehbio.com/ImageGP/).

