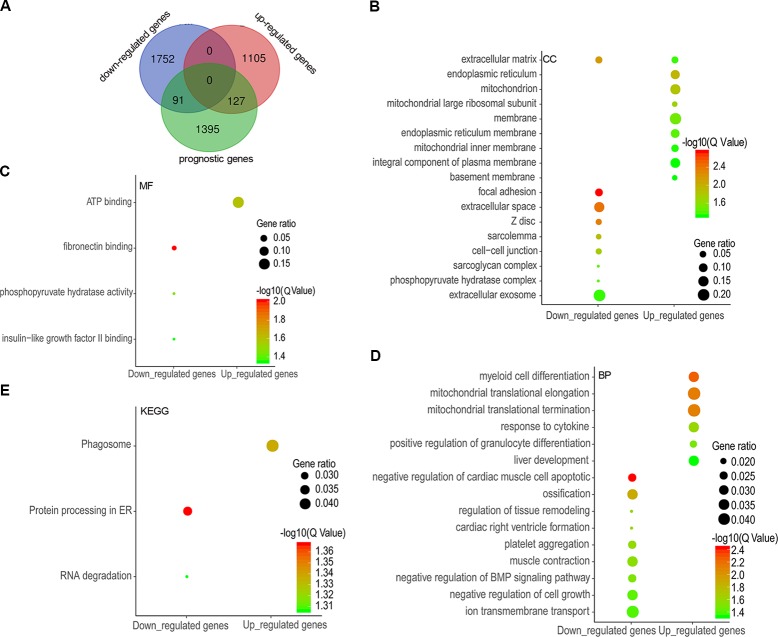
Figure 2.
Differentially expressed genes (DEGs) overlapping with prognostic genes and functional enrichment analysis. A total of 91 downregulated genes and 127 upregulated genes were overlapped with potential prognostic genes (A), and the enrichment results of cellular components (B), molecular functions (C), biological processes (D), and KEGG (E) were visualized as gene ontology (GO) enrichment plot by ImageGP.

