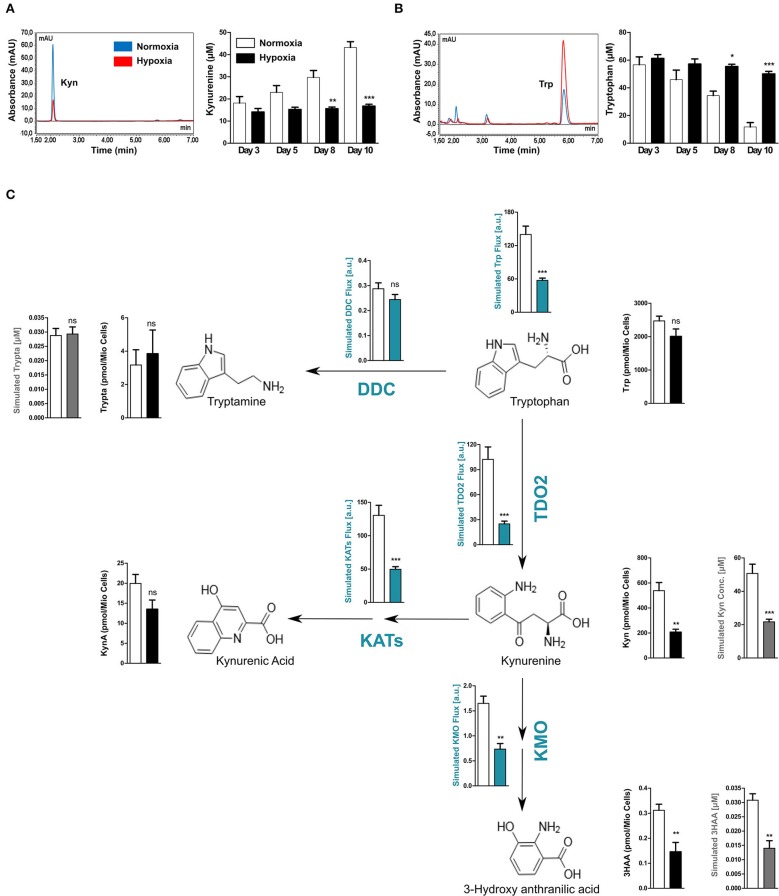
Figure 2.
Reduced TDO2 expression leads to reduced Trp flux through the KP. (A) uHPLC chromatogram (left) showing Kyn measured in supernatants of A172 cells exposed to 5 days of either normoxia (blue) or hypoxia (red). Quantification of Kyn measurements (right) in supernatants of A172 cells cultured either under normoxia (white) or hypoxia (black) for 3, 5, 8, or 10 days. (B) uHPLC chromatogram (left) showing Trp measured in supernatants of A172 cells exposed to 5 days of either normoxia (blue) or hypoxia (red). Quantification of Trp (right) in A172 cell supernatants cultured either under normoxia (white) or hypoxia (black) for 3, 5, 8, or 10 days. (C) Scheme depicting the most prominent changes in the flux through the Trp degradation pathway upon exposure to hypoxia (blue plots). Microarray data from A172 GBM cells upon 5 days of hypoxia exposure was integrated into a computational model of Trp metabolism to calculate the fluxes through different enzymes and the general flux through the entire pathway (blue plots) as well as to predict the intracellular metabolite concentrations (gray plots). These intracellular predictions were validated by measurements of the intracellular concentrations (black plots). Data from at least three independent experiments are expressed as mean ± S.E.M. Statistical significance is assumed at p < 0.05 (*p < 0.05, **p < 0.01, ***p <0.001). n.s., not significant.

