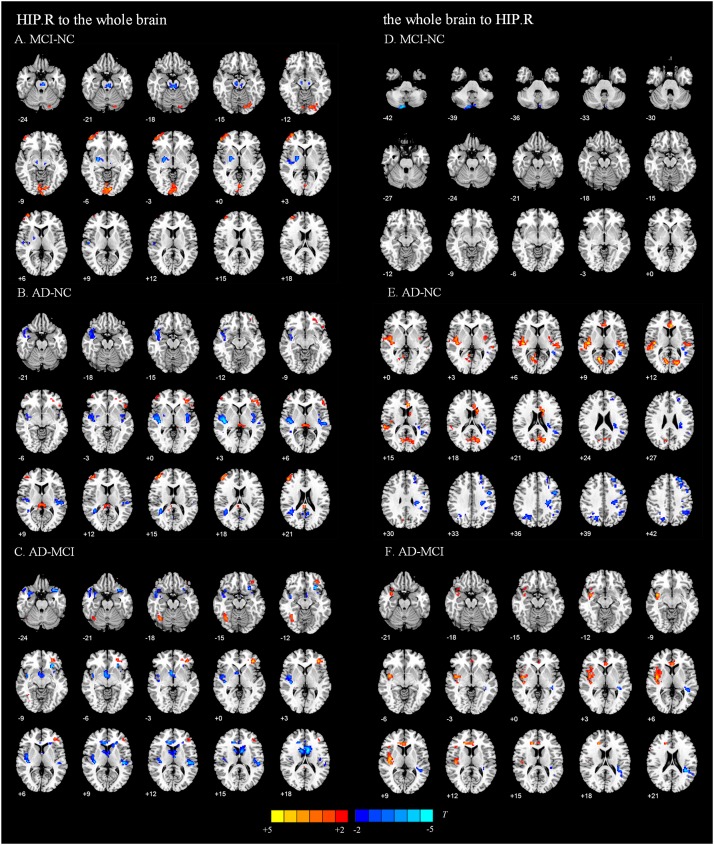
FIGURE 3.
Directed functional connectivity showing significant differences in the right hippocampus and whole brain pairwise comparisons. From the right hippocampus to whole brain, panel (A) represents the directed functional connectivity showing significant differences between the MCI and NC groups, panel (B) represents the directed functional connectivity showing significant differences between the AD and NC groups, and panel (C) represents the directed functional connectivity showing significant differences between the AD and MCI groups. From whole brain to the right hippocampus, panel (D) represents the directed functional connectivity showing significant differences between the MCI and NC groups, panel (E) represents the directed functional connectivity showing significant differences between the AD and NC groups, and panel (F) represents the directed functional connectivity showing significant differences between the AD and MCI groups. The red/yellow-colored brain regions indicate increased GCA values between groups. The blue/green-colored brain regions indicate decreased GCA values between groups.

