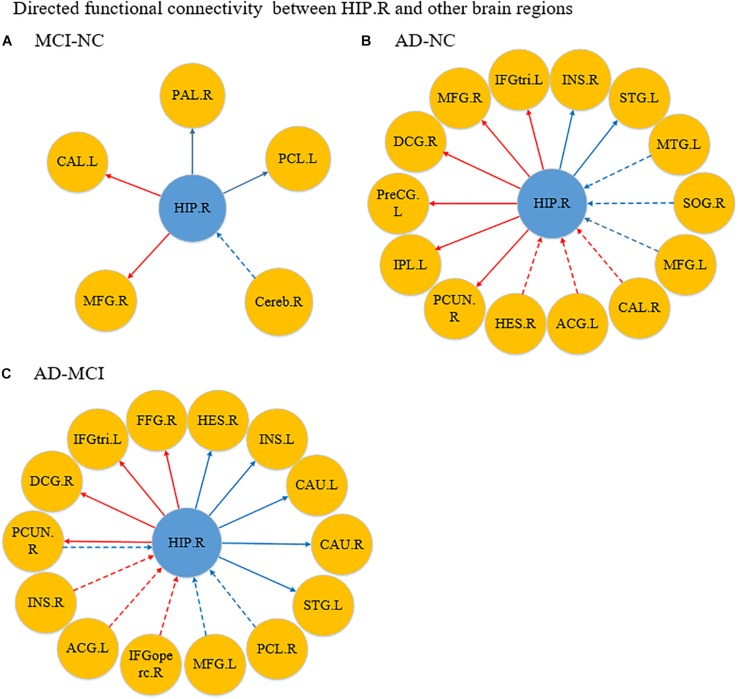
FIGURE 5.
Differences in directed functional connectivity from the right hippocampus to the whole brain and from the whole brain to the right hippocampus between each pair of groups. Panel (A) represents the comparison between the MCI and NC groups, panel (B) represents the comparison between the AD and NC groups, and panel (C) represents the comparison between the AD and MCI groups. The red line denotes that the GCA value in the former group was higher than the latter group, and the blue line denotes that the GCA value in the former group was lower than the latter group. The solid line indicates the directed functional connectivity from the hippocampus to other brain regions, and the dashed line indicates the directed functional connectivity from other brain regions to the hippocampus.

