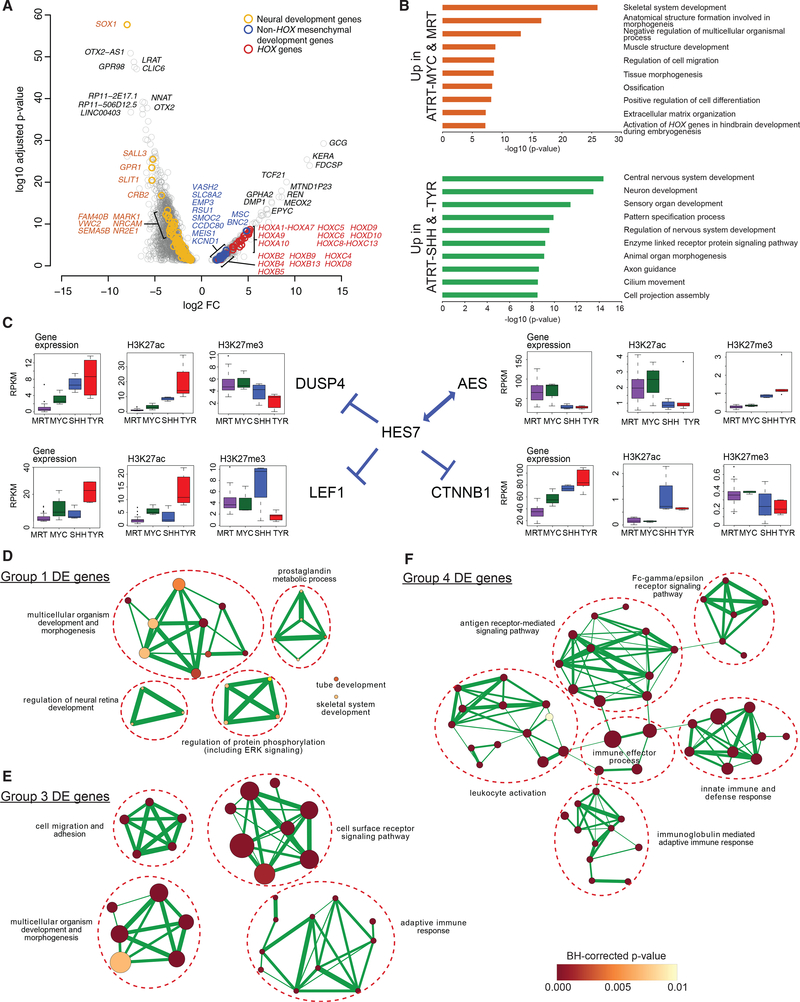
Figure 5. Dysregulation of Mesenchymal Development Genes Is Associated with ATRT-MYC and MRT, whereas Dysregulation of Neural Genes Is Associated with ATRT-SHH and -TYR.
(A) Volcano plot shows the statistical significance of differential expression (DE; adjusted p values < 0.05) on the y axis, and the fold change (FC) of gene expression in ATRT-MYC (n = 6 cases) and MRT (n = 65 cases) compared to ATRT-SHH (n = 11 cases) and -TYR (n = 8 cases) on the x axis. The top 20 significant DE genes, HOX genes, and genes involved in neural or mesenchymal development are labeled in colors as shown.
(B) Bar plots show the most significantly enriched pathways and adjusted enrichment p values based on analyses of 584 relatively overexpressed genes (top) and 2,500 relatively under-expressed genes (bottom) in MRTs and ATRT-MYC compared to ATRT-SHH and -TYR.
(C) Gene expression levels and H3K27ac and H3K27me3 densities (i.e., average read coverage) at the promoters of HES7 and its interactors are shown in boxplots.
(D-F) Enrichment map networks of Gene Ontology (GO) terms significantly enriched for Group-1- (D), Group-3- (E), and Group-4-specific (F) DE genes. A node size is proportional to the number of genes in the category and a node color indicates an adjusted enrichment p value. The edge thickness is proportional to a fraction of shared genes between GO terms.

