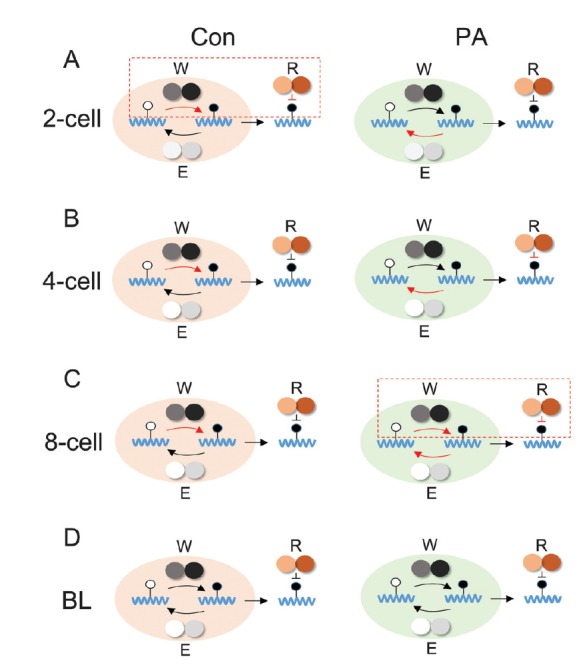
Figure 4. Schematic representations of m6A expression patterns in 2-cell (A), 4-cell (B), 8-cell (C), and blastocyst stage (D) of normal and PA embryos. BL indicates the blastocyst stage of the embryo. W indicates writer (METTL3 and METTL14). E indicates eraser (FTO and ALKBH5). R indicates reader (YTHDF2, IGF2BP1, and IGF2BP2). Red arrow and inverted T indicate the over expression of genes. The red dotted line indicates enhance m6A expression.

