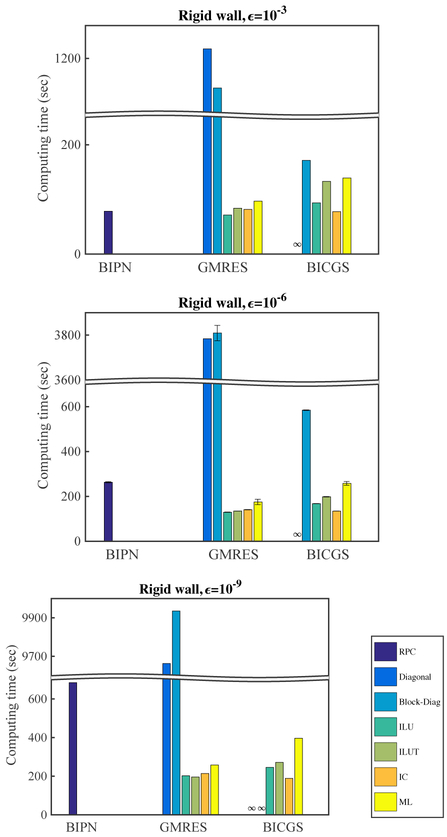
Fig. 2:
Compute times for linear solvers and preconditioners using a rigid pipe model with tolerances (top) ϵ = 10−3, (center) ϵ = 10−6, (bottom) ϵ = 10−9. For ϵ = 10−6, error bars are plotted by taking standard deviations from two repeated simulations. Differences between repeated simulations are caused by different computing nodes assigned by the scheduler on the Comet cluster.

