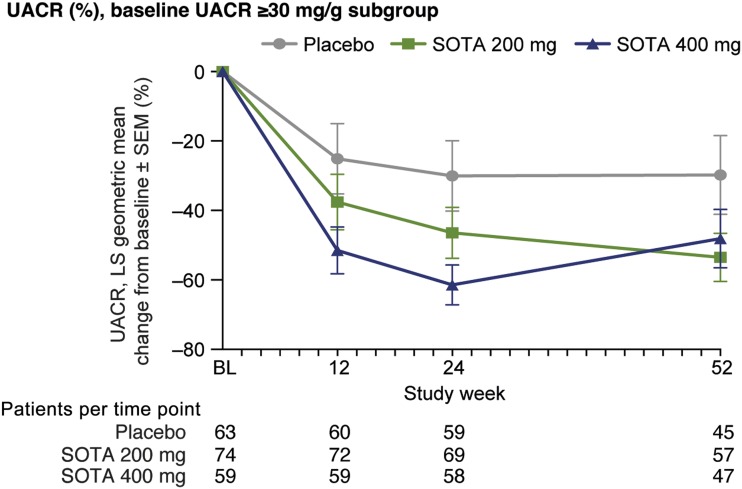
Figure 2.
UACR change over time in subgroup of participants with baseline (BL) albuminuria (UACR ≥30 mg/g). Percentage change from baseline vs. placebo based on geometric mean estimated from MMRM model. At week 52, SOTA 200 mg, −23.7% (95% CI −48.9, 1.5), P = 0.054, and SOTA 400 mg, −18.3% (−45.3, 8.7), P = 0.18.

