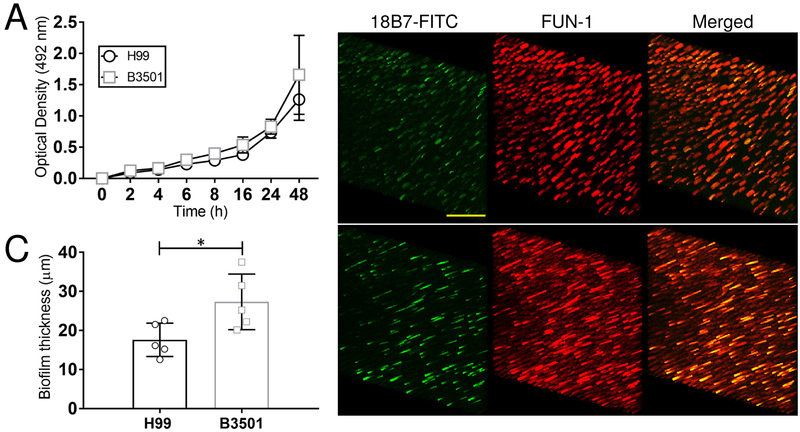
Fig. 1. Biofilm formation by C. neoformans strains H99 (serotype A) and B3501 (serotype D).
(A) The kinetics of biofilm formation by C. neoformans strains H99 and B3501 was compared and determined using XTT reduction assay. Each time point denotes the average of four independent measurements per strain and error bars indicate standard deviations (SDs). (B) Confocal microscopic images of C. neoformans H99 and B3501 strain biofilms after 48 h. Representative images of mature fungal biofilms showed metabolically active (red; FUN-1-stained) cells embedded in the polysaccharide extracellular material (green; stained with mAb 18B7-FITC-conjugated GAM IgG1). The pictures were taken at a magnification of ×63. Scale bar, 20-μm. (C) The thickness of the cryptococcal biofilms was determined using Z-stack reconstruction. Bars are the averages of the results for five independent measurements (each symbol represents an individual measurement) per strain, and error bars denote SDs. Asterisk denotes P-value significance (P < 0.05) calculated by Student’s t-test. For A-C, each experiment was performed twice, and similar results were obtained.

