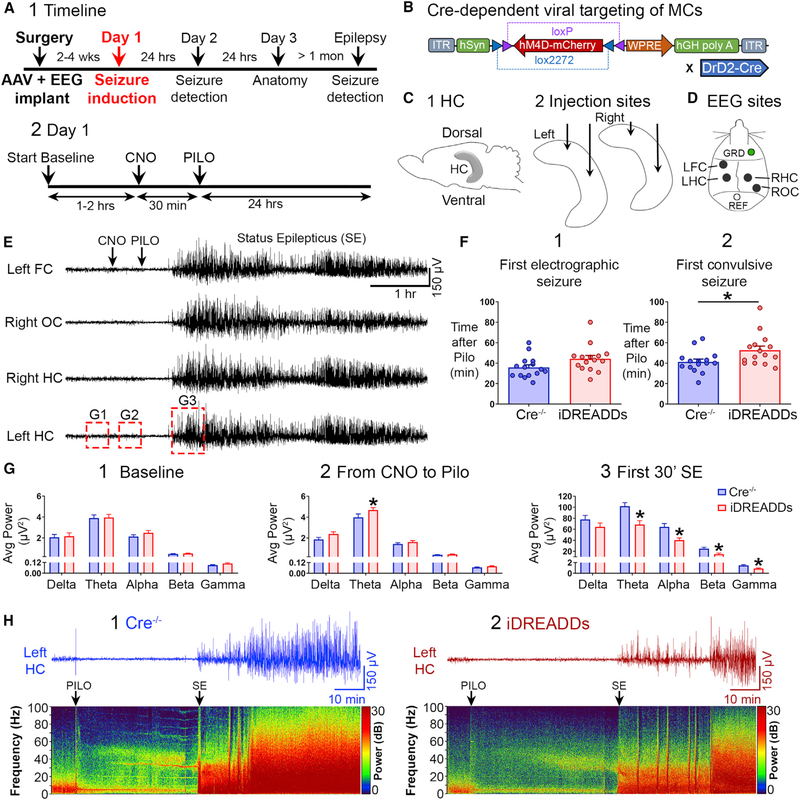
Figure 1. Inhibiting MCs with iDREADDs Attenuates Pilocarpine-Induced SE.
(A1) Timeline. Mice underwent surgery for viral injection and implant of an EEG recording assembly. SE was induced 2–4 weeks later with the convulsant pilocarpine (day 1). EEG was conducted 24 h later (day 2; see Figure 3), neuronal injury was assessed in a subset of mice on day 3 (see Figure 4), and the remaining mice were recorded by vEEG for 2 weeks to quantify chronic seizures (see Figure 5).
(A2) Expanded day 1 timeline shows the sequence of procedures in more detail.
(B) The Cre-dependent viral construct used in iDREADDs experiments was AAV-hSyn-DIO-hM4D(Gi)-mCherry.
(C1) Schematic of the hippocampus.
(C2) Virus was injected into the dorsal and ventral hippocampus, bilaterally.
(D) Subdural screw electrodes were positioned over the left frontal cortex (FC), the left and right dorsal hippocampus (HC), and the right occipital cortex (OC) for vEEG recordings.
(E) Representative 6-h EEG recording showing SE onset (the first 30 min of SE). After a ~1-h baseline period, all mice were injected with CNO, followed by pilocarpine 30 min later. Seizures began within the next 60 min and lasted several hours.
(F1) There were no group differences in the latency to the first electrographic seizure.
(F2) The latency to the first convulsive seizure was significantly delayed in iDREADDs compared to Cre−/− mice.
(G1) There were no group differences in baseline EEG power.
(G2) MC inhibition selectively increased theta power during the CNO period.
(G3) MC inhibition reduced theta, alpha, beta, and gamma power during SE onset.
(H1 and H2) Representative 2-h EEG record and corresponding spectrograms showing the pilocarpine injection and SE onset. Note that EEG power was reduced in iDREADDs relative to Cre−/− mice during SE onset. Data are represented as mean ± SEM. *p < 0.05.
See also Figures S1, S2, and S6.

