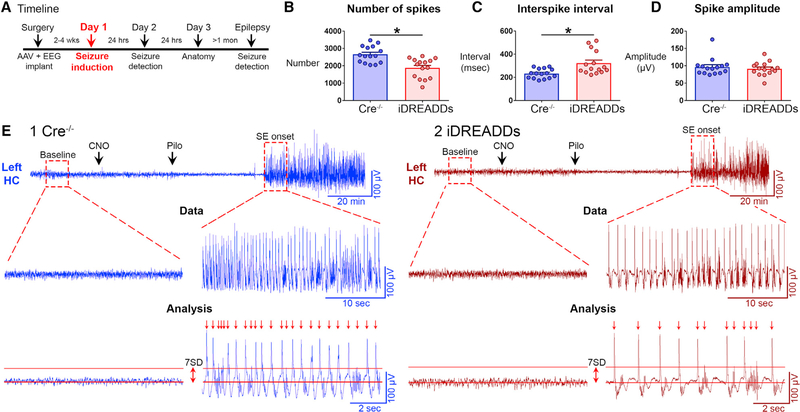
Figure 2. Inhibiting MCs Reduces Spike Number and Frequency of the Hippocampal EEG during SE Onset.
(A) Timeline of the entire study showing the timing of day 1, when data in the figure were taken.
(B) The number of spikes during the first 10 min of SE was significantly greater in Cre−/− than in iDREADDs mice.
(C) The interval between spikes (interspike interval) was significantly greater in iDREADDs than in Cre−/− mice.
(D) Mean spike amplitude did not differ between groups.
(E1 and E2) Representative Cre−/− and iDREADDs recordings show the onset of SE following pilocarpine injection. A threshold of 7 SD ≥ the RMS of the baseline EEG amplitude was set as the criterion for spike detection. No events met this criterion during the baseline recordings. After SE began, events termed spikes (arrows) that exceeded the ≥7 SD threshold criterion were analyzed. Data are represented as mean ± SEM. *p < 0.05.
See also Figure S2.

