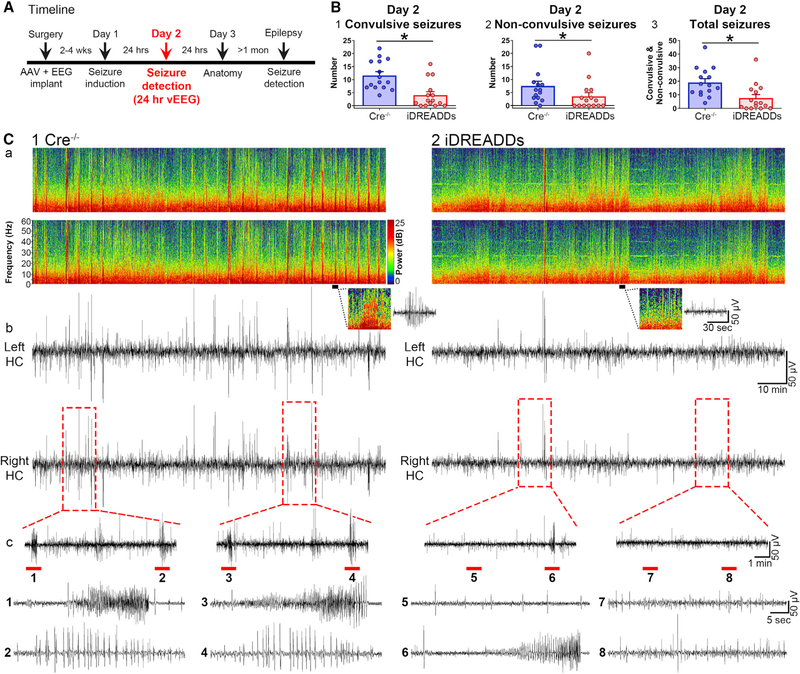
Figure 3. Inhibiting MCs during SE Reduces Seizure Burden the Following Day.
(A) Timeline of the entire study showing the timing of day 2, when data in the figure were taken.
(B1) The number of day 2 convulsive seizures from 24 to 48 h after SE was significantly reduced in iDREADDs compared to Cre−/− mice.
(B2) The number of day 2 non-convulsive seizures was significantly reduced in iDREADDs compared to Cre−/− mice.
(B3) The total number of convulsive and non-convulsive seizures was significantly reduced in iDREADDs compared to Cre−/− mice.
(C1a and C2a) Representative spectrogram from the left and right dorsal hippocampus in Cre−/− and iDREADDs mice. Inset: 1-min-long spectrogram and corresponding EEG showing spikes in the Cre−/− EEG record with high power at high frequencies (>20 Hz) relative to the iDREADDs record.
(C1b and C2b) EEG record corresponding to the spectrograms.
(C1c and C2c) Insets show seizures (1, 3, 6) or bursts of spikes (2, 4, 5, 7, 8) that were more frequent in Cre−/− mice. Data are represented as mean ± SEM. *p < 0.05.

