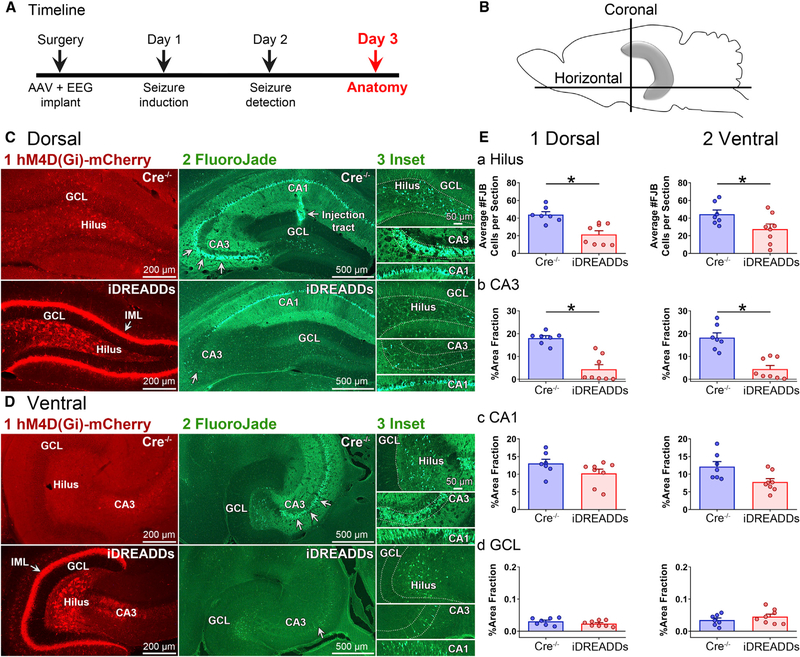
Figure 4. Inhibiting MCs during SE Reduces Neuronal Injury.
(A) Timeline of the entire study showing the timing of day 3, when data in the figure were taken.
(B) Schematic of the hippocampus and sectioning planes. The dorsal hippocampus was evaluated with coronal sections, whereas the ventral hippocampus was evaluated using horizontal sections.
(C and D) Representative dorsal (C) and ventral (D) hM4D(Gi)-mCherry and FluoroJade photomicrographs in Cre−/− and iDREADDs mice 3 days after SE. Note the viral expression in the IML (arrow) and hilus in iDREADDs mice, but not Cre−/−. Viral expression coincided with reduced FluoroJade staining, suggesting that there was less hilar and CA3 neurodegeneration when MCs were inhibited during SE. Scale bars: 200 μm, 500 μm, and 50 μm (insets).
(E1a and E2a) Quantification of iDREADDs mouse sections revealed significantly fewer hilar FluoroJade-stained cells compared to Cre−/−.
(E1b and E2b) There was a smaller area of the CA3 cell layer stained by FluoroJade (arrows) in iDREADDs compared to Cre−/− mice.
(E1c and E2c) FluoroJade staining did not significantly differ between Cre−/− and iDREADDs mice in CA1. d. FluoroJade staining in the GCL was minimal in both groups. Data are represented as mean ± SEM. *p < 0.05.
See also Figure S3.

