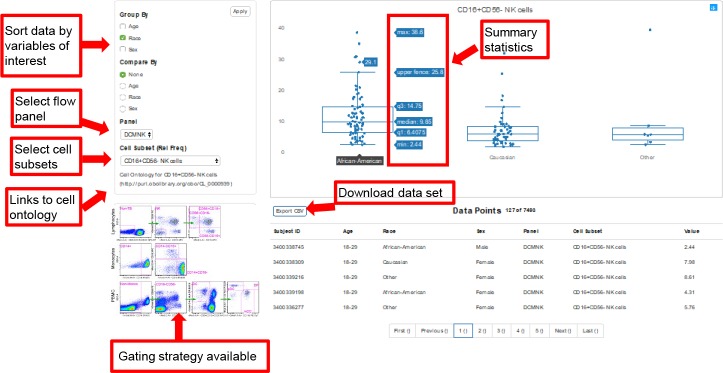
Fig 1. Example of web-based data visualization tool.
Researchers have the ability to select reference ranges for flow cytometry panels of interest by age, gender, and race filters. This tool will calculate summary statistics on the selected population and the data may be downloaded for study. Links to cell ontology are present when applicable, and the gating strategies are available. Gating strategies and summary tables are also available.

