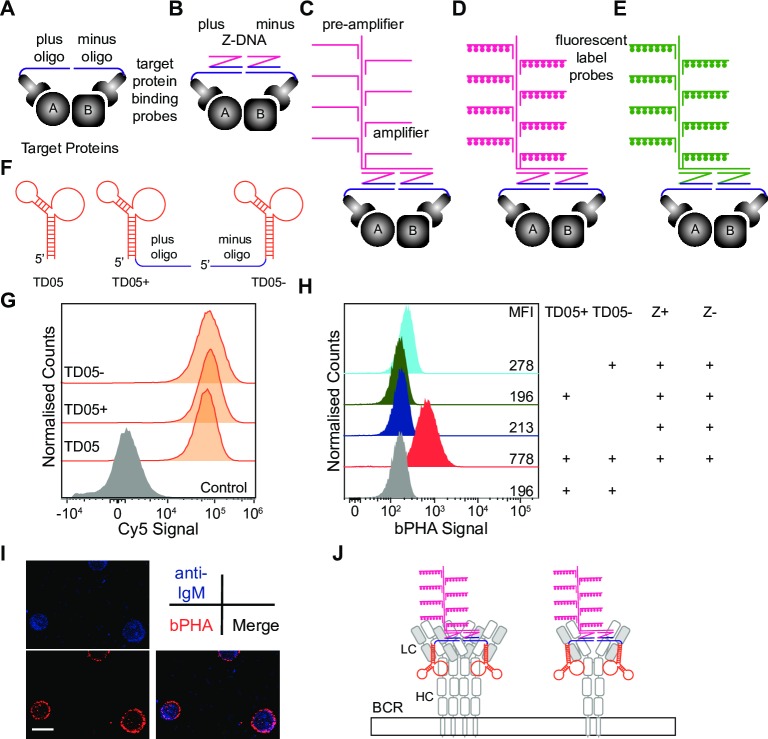
Fig 1. The bPHA specifically detects the proximal localization of BCRs on Ramos cell surface.
(A-D) Schematic presentation of bPHA. The proximity of protein A and protein B is converted to the proximity of plus and minus oligos. The oligos are then hybridized to Z-DNA, followed by preamplifier, amplifier, and finally, fluorescent label probes. (E) Diagram showing that changing a part of the Z-DNA allows the change of fluorescence of bPHA signal. (F) Schematic presentation of TD05 aptamer and the TD05− and TD05+ derivatives. (G) Flow cytometry results showing similar staining of Ramos cells with Cy5-labeled TD05, TD05+, and TD05−. Cells stained with Cy5-coupled unrelated aptamer functioned as negative control. (H) TD05+:TD05− bPHA signal measured by flow cytometry for Ramos cells treated with the indicated probes. (I) Confocal microscopic images of Ramos cells after bPHA and anti-IgM staining. (G-I) Data represent at least three independent experiments. (J) Schematic drawing explaining what could be measured by the TD05+:TD05− bPHA. BCR, B cell antigen receptor; bPHA, branched proximity hybridization assay; Cy5, cyanine 5; HC, heavy chain; IgM, immunoglobulin M; LC, light chain; MFI, mean fluorescence intensity.

