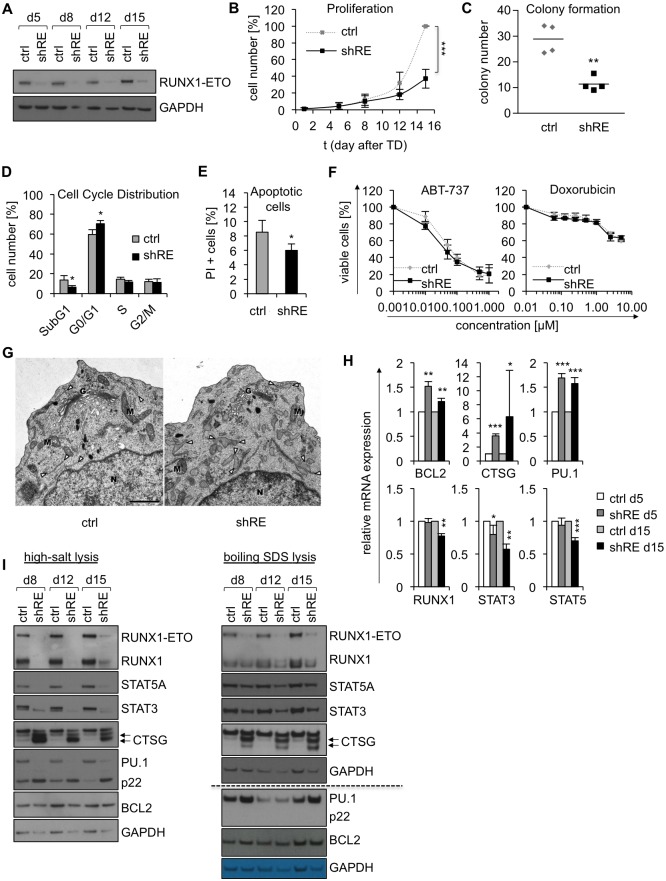
Fig 1. Phenotype of RUNX1-ETO knockdown and kinetics of protein/mRNA expression in Kasumi-1.
A) Kasumi-1 cell lysates were prepared in SDS buffer at the indicated time points post transduction and RUNX1-ETO depletion was confirmed by Western Blot (n = 3). B) Cell expansion of Kasumi-1/ctrl and Kasumi-1/shRE was determined by counting and trypan blue exclusion, and growth curves depict cell numbers relative to control cells at day 15 after lentiviral transduction (n = 4). C) Number of Kasumi-1/ctrl and Kasumi-1/shRE colonies, as counted nine days after plating in limiting dilution (n = 4). Cell cycle distribution (D) of Kasumi-1/ctrl and Kasumi-1/shRE and the percentage of apoptotic cells (E) were determined by PI staining and subsequent flow cytometry at day twelve after transduction (n = 4). F) The response of Kasumi-1/ctrl and Kasumi-1/shRE to ABT-737 and Doxorubicin was measured by MTS Assay and PI staining, respectively, at day 14 post transduction (n = 3). The percentage of viable cells is shown relative to untreated cells after 48 hours of treatment with the indicated drug concentrations. G) Transmission electron microscopy of Kasumi-1/ctrl (left) and Kasumi-1/shRE (right) cells, representative for three independent experiments. N, nucleus; G, Golgi; M, mitochondria. Profiles of ER cisternae are highlighted by arrowheads. Note the flat and evenly formed ER cisternae in Kasumi-1/ctrl, compared to frequently dilated cisternae in Kasumi-1/shRE cells. Scale bar = 1 μm. Protein and mRNA expression of RUNX1-ETO target genes were analyzed at the indicated time points after lentiviral transfer of RUNX1-ETO-specific shRNA. H) mRNA expression was determined relative to control cells and normalized to housekeeping control. I) Whole-cell lysates of Kasumi-1/ctrl and Kasumi-1/shRE were prepared in high-salt lysis buffer (left, n = 4) or boiling SDS buffer (right, n = 3) and analyzed by Western Blot. Dashed line indicates separate membranes. Data are represented as mean +/- SD and p-values were calculated using 2-way ANOVA (B+F) or two-sided student´s t-test (C,D,E,H). *p<0.05, **p<0.01, ***p<0.001.

