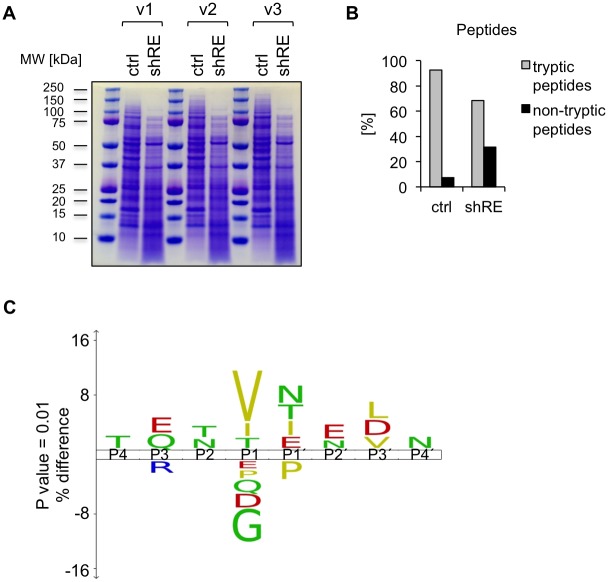
Fig 2. Mapping of protease cleavage sites by mass spectrometry.
A) Whole cell lysates of Kasumi-1/ctrl and Kasumi-1/shRE cells were prepared in RIPA buffer supplemented with cOmplete Protease Inhibitor Cocktail (Roche) on day twelve after transduction. Proteins were separated by SDS PAGE, stained with Coomassie blue (n = 3) and subjected to LC-MS analysis. B) The identified peptides were categorized as tryptic peptides, resulting from trypsin digestion during the MS sample preparation procedure, or non-tryptic peptides, resulting from proteolytic cleavage during cell lysis. C) IceLogo showing amino acids at positions P4-P4´, which are enriched or depleted in peptides from Kasumi-1/shRE compared to Kasumi-1/ctrl with p<0.01. Red, acidic; blue, basic; yellow, nonpolar hydrophobic; green, polar neutral amino acids. Results shown in B) and C) are representative for one of three independent measurements.

