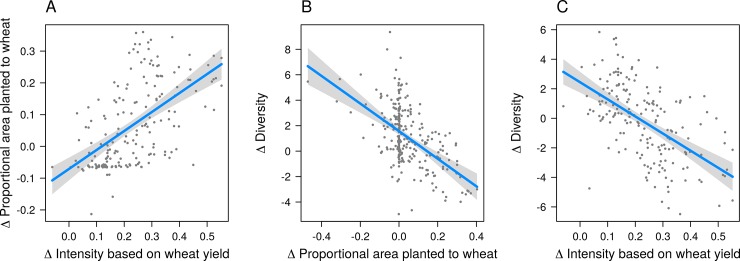
Fig 7. Regression models of the relation between agricultural intensification and changes in crop diversity in India between 1956 and 2008 at the district level.
(A) Increase in the proportion of area planted to wheat as a response to wheat intensification. (B) Decline in crop diversity as a response to an increase in the proportion of area planted to wheat. (C) Decline in crop diversity in response to an increase in wheat yields. Other variables included in the linear models (not shown) were set to their median values.

