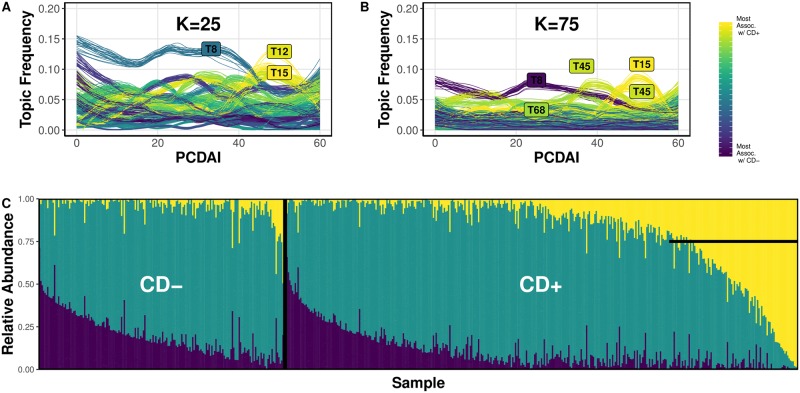
Fig 2.
(A). The relationship between topic frequency within a sample and that sample’s Crohn’s Disease (CD) severity (PCDAI score) for the 25-topic STM. Each line represents the frequency of a topic as a function of sample PCDAI score. High frequency topics are labeled. Violet and yellow color-coded trajectories designate CD- and CD+ associated topics, respectively. Posterior sampling was performed across 25 replicates, with each line plotted to represent the distribution of the topic frequency trajectories. (B). Trajectories for the 75-topic model. (C). The relative abundance of OTUs in the (input) OTU relative abundance table for “noteworthy” OTUs from high-ranking-topics. The left and right panels show the relative abundance of these OTUs in each CD- and CD+ sample, respectively. Noteworthy OTUs are defined as high-frequency OTUs, sampled from the posterior distribution, that concentrate into high-ranking-topics (yellow = CD+ topic group, violet = CD- topic group, green = unassociated topic group). The horizontal line marks a subset of samples that contain a large proportion of the OTU profile associated with CD+ high-ranking-topics.

