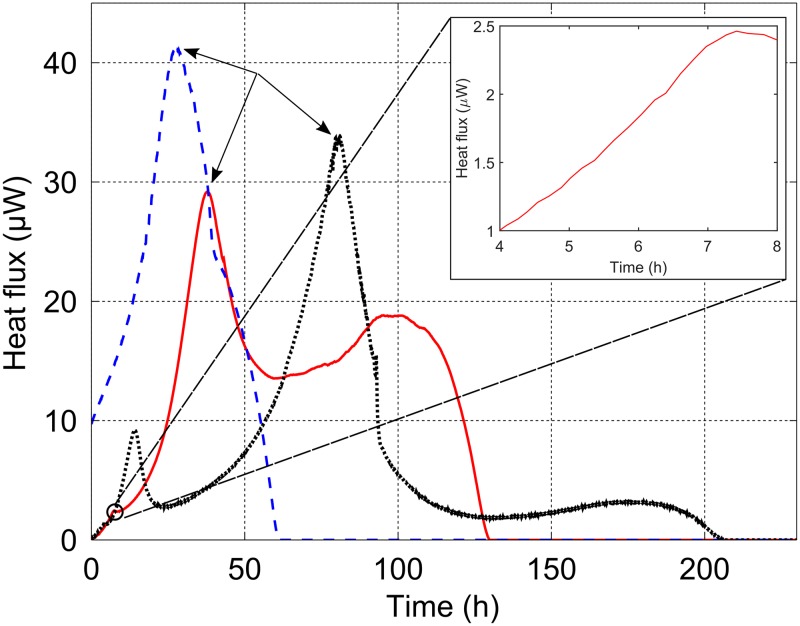
Fig 2. Example of isothermal calorimetric curves for M. ruminantium (dashed blue line), M. smithii (solid red line) and M. formicium (dotted black line).
The dominant metabolic phase is represented by one peak (shown with the arrows). The magnitude of the peak differs between the methanogens and also the slope of the heat flux trajectories. The return of the heat flux to the zero baseline also differs between the three methanogens. The inset zoom displays the peak exhibited by M. smithii at 7.4 h.

