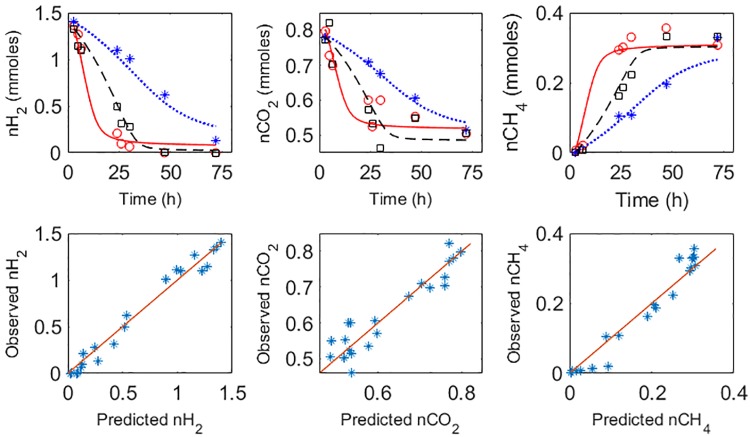
Fig 3. Assessment of model performance.
Top plots: dynamics of methanogenesis by M. ruminantium (*), M. smithii (○) and M. formicium (□). Experimental data (*,○,□) are compared against model predicted responses: dotted blue lines (M. ruminantium), solid red lines (M. smithii) and dashed black lines (M. formicium). Bottom plots: summary observed vs predicted variables. The solid red line is the isocline.

